Chainalysis Market Intel provides live data and insights on the cryptocurrency market. Read up and subscribe here to get our weekly Market Intel Report delivered to your inbox.
As of this writing on November 19, 2020, Bitcoin’s price is hovering around $18,000, which means one thing: We’re in the midst of a price surge not seen since the famous bull run of late 2017, when Bitcoin’s price topped out at just under $20,000. But while it’s tempting to compare today to 2017, the current price surge differs in a few key ways. Below, we outline the underlying conditions driving Bitcoin’s price increases now, and explain some of the key ways they differ from the conditions of 2017.
Why is Bitcoin surging now? Here’s what the data says
Bitcoin’s price is rising because demand for Bitcoin is increasing at a time when there’s relatively few Bitcoin available to buy. While the total supply of Bitcoin grows every day as more is mined, the actual amount available to buy depends on whether holders want to sell or trade it. At Chainalysis, we quantify this by tracking the amount of Bitcoin held in wallets that send less than 25% of Bitcoin they’ve ever received, which we refer to as illiquid or investor-held Bitcoin, versus Bitcoin held in wallets that send more than that, which we refer to as liquid or trader-held Bitcoin. The chart below shows how the amount of Bitcoin in each category has changed since January 2017 alongside price, thereby capturing the market dynamics of both the current price surge and that of 2017.
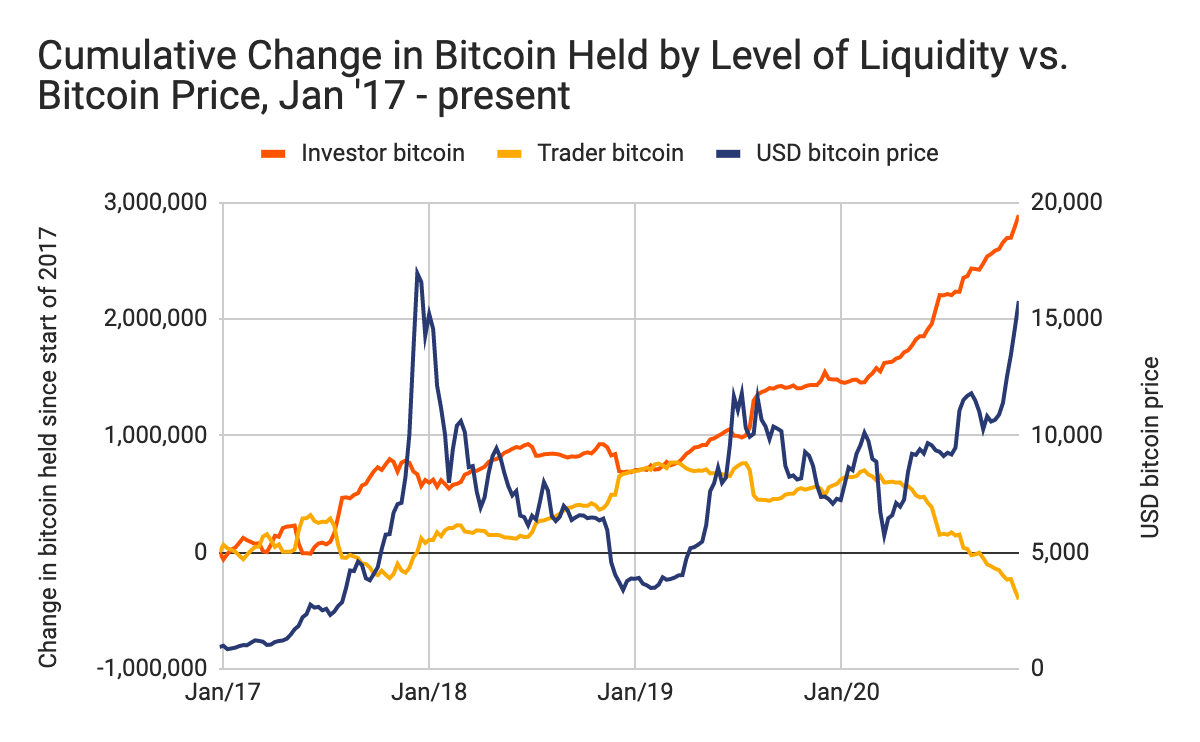
Right now, the amount of liquid Bitcoin is similar to what it was during the 2017 bull run. But the amount held in illiquid wallets is much higher, currently representing 77% of the 14.8 million Bitcoin mined that isn’t categorized as lost, meaning it hasn’t moved from its current address in five years or longer. That leaves a pool of just 3.4 million Bitcoin readily available to buyers as demand increases. Demand is increasing, as evidenced by rising inflows to exchanges and trade intensity on exchanges. Trade intensity measures the number of times each Bitcoin deposited on a spot exchange is traded within that exchange before moving off the platform, and is a good proxy for demand on a given exchange. It is currently 38% above the 180 day average.
How is this surge different from 2017?
The key difference lies in who’s buying Bitcoin and why. In 2017, most demand came from individual, retail investors buying with their own personal funds, many of whom had varying degrees of experience with and knowledge of cryptocurrency. As anyone who reads the news can tell you, 2020 is the year institutional dollars began flowing into Bitcoin. From high-profile investors like hedge fund manager Paul Tudor Jones, who compared buying Bitcoin to investing early in Apple or Google, to corporations like Square, which invested $50 million or 1% of its total assets in Bitcoin, mainstream companies and financial institutions are turning to Bitcoin.
The institutional move into cryptocurrency appears to be driven by a desire to hedge against macroeconomic uncertainty, which of course hasn’t been in short supply this year. Jones himself put it well, saying, “Back in March and April, it became really apparent, given the monetary policy that was being pursued by the Fed, the incredible quantitative easing they were doing and other central banks were doing, that we were in an unprecedented time…one had to begin to think about how you defend yourself against inflation.”
The data bears out this institutional investment story as well. For one, we’re seeing an increase in high value transfers sent from exchanges in 2020.
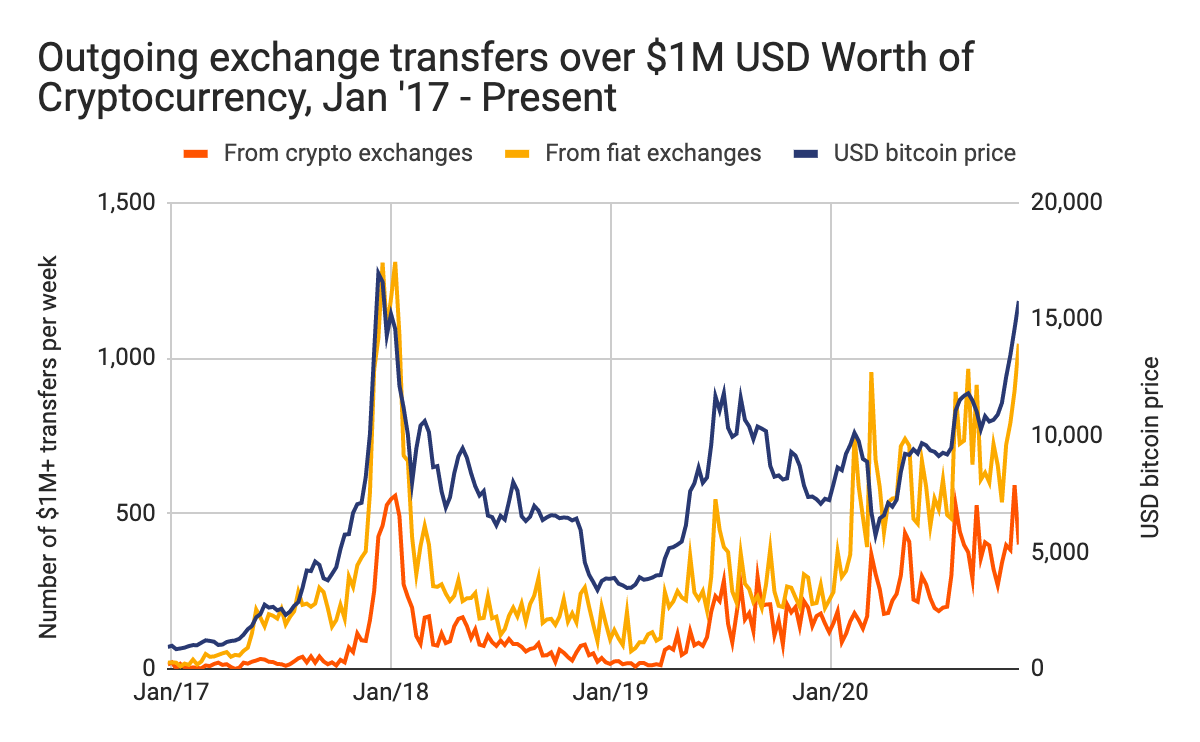
Exchanges have sent 19% more transfers worth $1 million or more in 2020 while Bitcoin’s price has been over $10,000 as compared to 2017. That suggests that the individuals behind these transfers have more money to spend, as we would expect when bigger investors get involved.
We’re also seeing large inflows to exchanges primarily serving North America during this surge compared to 2017, when trading activity in Asia was driving more of the market.
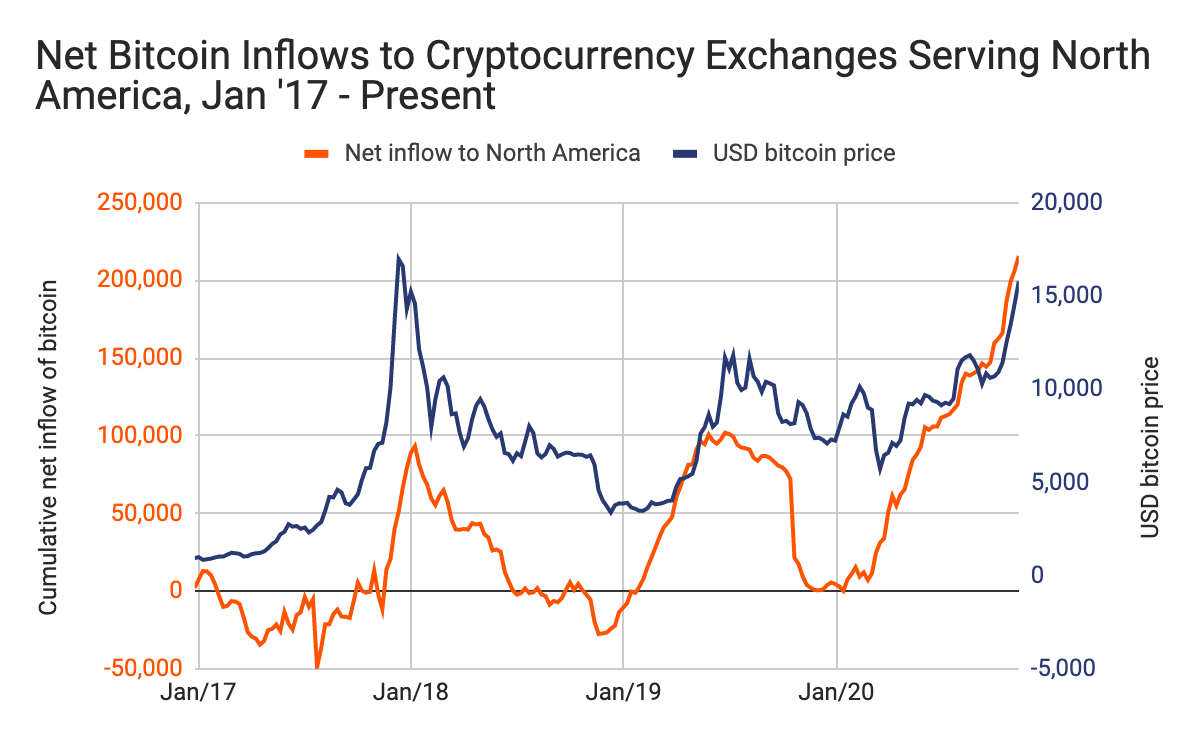
North American exchanges were losing Bitcoin on net in the early part of the 2017 bull run, and became a net receiver as price began to peak. This time around though, North American exchanges have been in the green throughout, with inflows ramping up to higher levels than at any point in the 2017 run in the last few months. This is what we would expect to see, as the institutional investors driving the current surge, themselves primarily based in North America and Europe, are more likely to buy Bitcoin on these exchanges for both ease of use and regulatory reasons.
Similarly, we also see much higher net inflows to exchanges allowing crypto-to-fiat (C2F) trades compared to 2017.
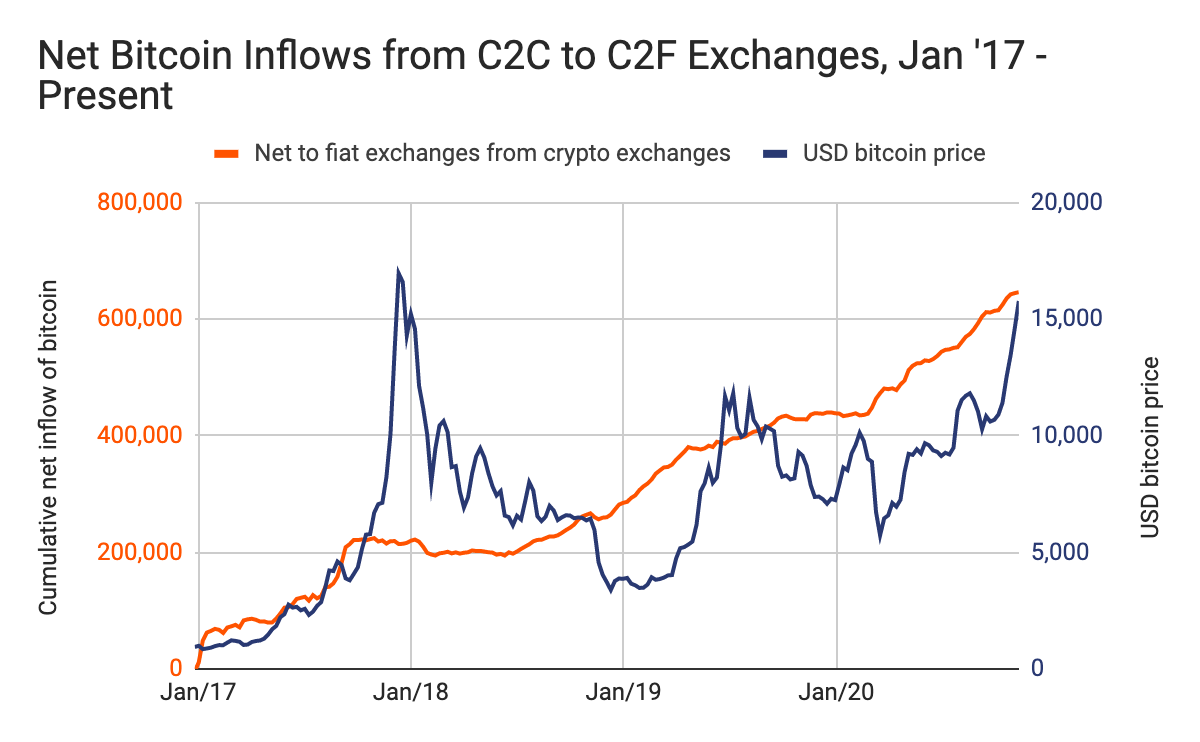
C2F exchanges are playing a bigger role in this surge than in 2017, when crypto-to-crypto (C2C) exchanges, used mostly by traders swapping many different types of cryptocurrency, drove more of the market. This, combined with the accumulation of Bitcoin by investor wallets that tend to hold for long periods of time, suggests that first-time Bitcoin buyers and buyers looking to unload fiat currency for Bitcoin as a hedge against worrisome macroeconomic trends are responsible for much of the current demand.
Investors’ view of Bitcoin as a safe haven asset becomes clearer when we compare its use this year to Ethereum’s. Again, more Bitcoin than ever before is becoming illiquid as it moves into wallets that send very little of the Bitcoin they acquire, instead holding it for long-term investment. Ethereum, on the other hand, is becoming more liquid, moving into wallets that not only trade frequently, but that are also quite new.
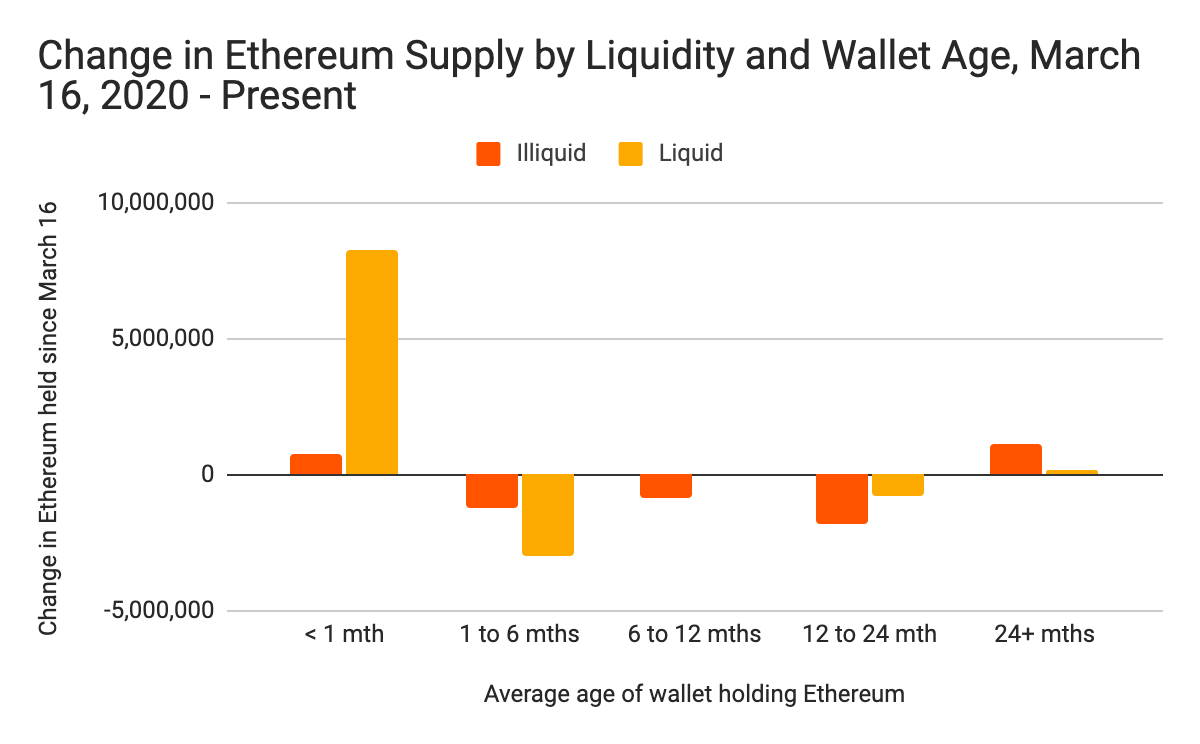
The chart above shows that since mid-March, over 8 million ETH moved into liquid wallets less than one month old at the time of acquisition. This represents a structural change in how Ethereum is used, as there’s never before been such a shift of Ethereum into young wallets that transact frequently. DeFi is driving this new use case, as users are sending Ethereum into DeFi protocols where it can be used to trade a variety of assets in pursuit of yield. This difference in usage didn’t exist in 2017 — at that time, investors appeared to be buying different cryptocurrencies more indiscriminately to cash in on hype as prices rose. The development of distinct use cases for Bitcoin and Ethereum in 2020 suggests a more mature market, which one would expect given the influx of institutional investors driving the current Bitcoin price surge.
This is good news for cryptocurrency
While we can’t know if prices will continue to rise, the current Bitcoin surge portends good things for cryptocurrency — not just because prices are rising, but because of why they’re rising. A comparison of this bull run to that of 2017 suggests that investors have become savvier and more strategic, buying Bitcoin to fulfill a specific use case rather than to speculate on the new hot asset. If Bitcoin can continue to be an effective hedge against macroeconomic trends, we believe more and more institutional investors will put money into the asset, leading to even more mainstream adoption.
Want more data on cryptocurrency flows and analysis of what it means for the market? Check out Chainalysis Market Intel and subscribe to our weekly Market Intel Report.