This analysis is a preview of our State of Web3 Report. Sign up here to download your copy!
Summary
The collapse of TerraUSD (UST) had three stages. First, two traders broke UST’s peg; next, Terraform Labs and three supporters repaired it by purchasing $2B UST; finally, the continued sell-off drained those funds, hyperinflated UST’s sister token LUNA, and crashed the price of both LUNA and UST.
UST’s uncollateralized design likely made it more fragile than other stablecoin types. Furthermore, while redemptions of other stablecoins did temporarily peak, the crypto market’s recent downturn appears more closely linked to the tech market decline than to UST’s collapse.
Contents
- The three stages of UST’s collapse
- Undercollateralized vs. overcollateralized vs. fiat-backed stablecoins
- The macroeconomic impacts of the collapse
The three stages of UST’s collapse
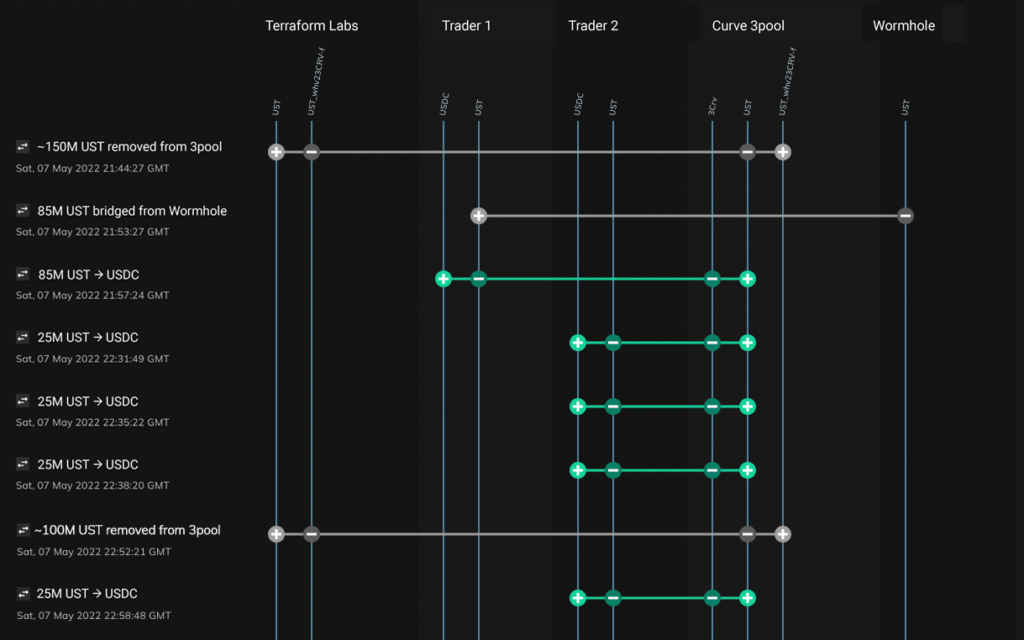
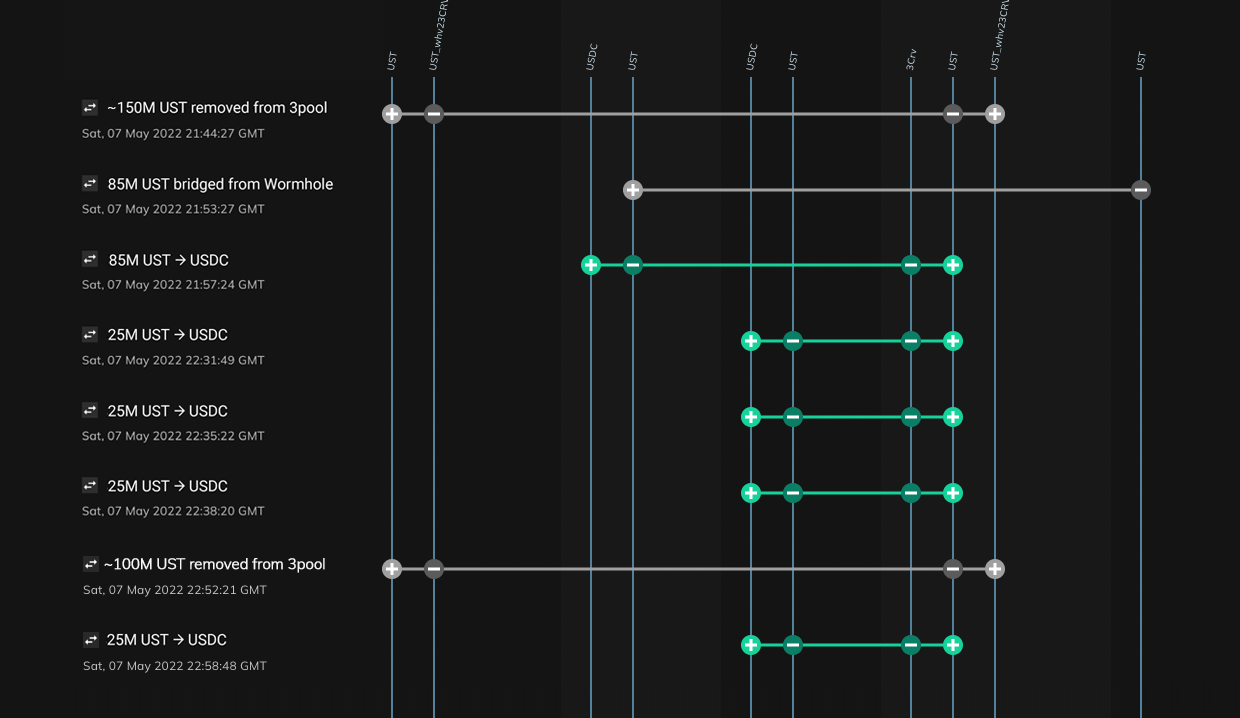
On the night of May 7th, Terraform Labs withdrew 150 million UST from 3pool, a decentralized stablecoin exchange, as part of a planned, public effort to move these funds to another pool. This made the pool more “shallow,” i.e. prone to volatility.
Thirteen minutes later, one trader – perhaps taking advantage of this vulnerability – swapped 85 million UST for USDC. Over the next hour, another trader then swapped a total of 100 million UST for USDC in increments of 25 million.
In response, Terraform Labs withdrew another 100 million UST from 3pool. This was intended to “rebalance” the ratio of UST to other stablecoins.
But by then, these large trades – and a number of much smaller ones – had already broken UST’s peg.
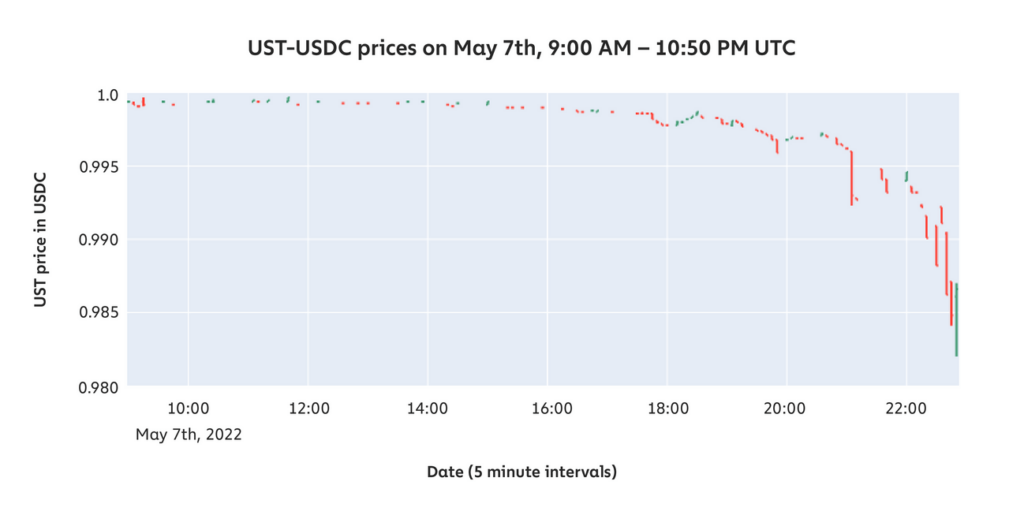
Investors panicked, the sell-off began, and many holders with their UST deposited in Anchor started to withdraw their funds.
A note on Anchor
Anchor is a DeFi protocol operated by Terraform Labs, the creators of UST. For most of its existence it has paid 19.5% APY on any quantity of deposited UST. It has then lended these deposits at APRs that typically vary from 2% to 15%. Only about one half to one sixth of the deposited UST has been lent out to borrowers at any given time.
On March 13th, Bybit estimated that “at the current yield reserve of $24.7M UST and current ratio of deposits & borrowings … [Anchor has] a runway of about ~13 days before yield reserves have completely depleted.” In mid-April, Decrypt reported that more than 72% of all UST was deposited in Anchor – indicating that a significant reason for holding UST may have been to earn Anchor’s yields.
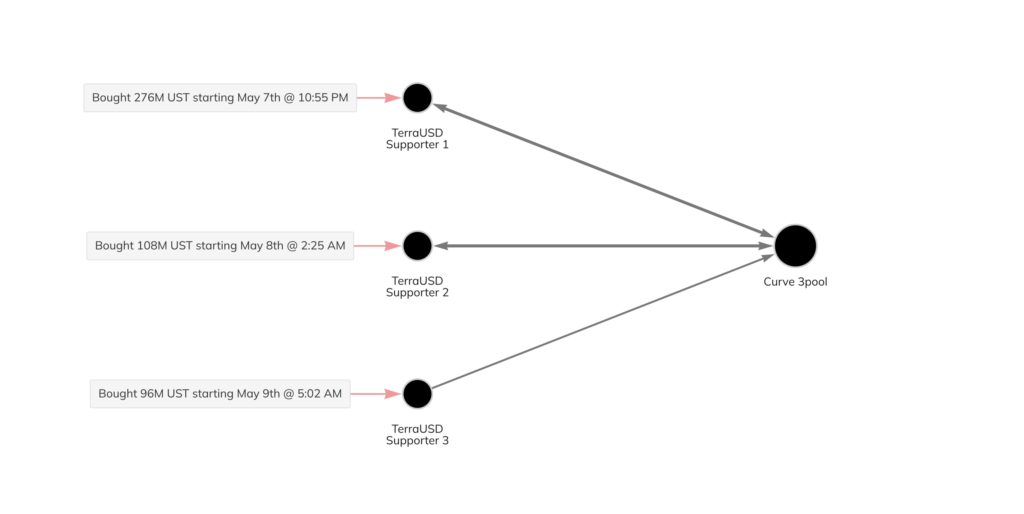
To repair the peg and rebalance 3pool, three unidentified UST supporters swapped a combined $480 million USDT for UST on May 7th, 8th, and 9th.
Then, on May 9th, the Luna Foundation Guard (LFG) sold billions worth of Bitcoin from its reserves to swap for UST.
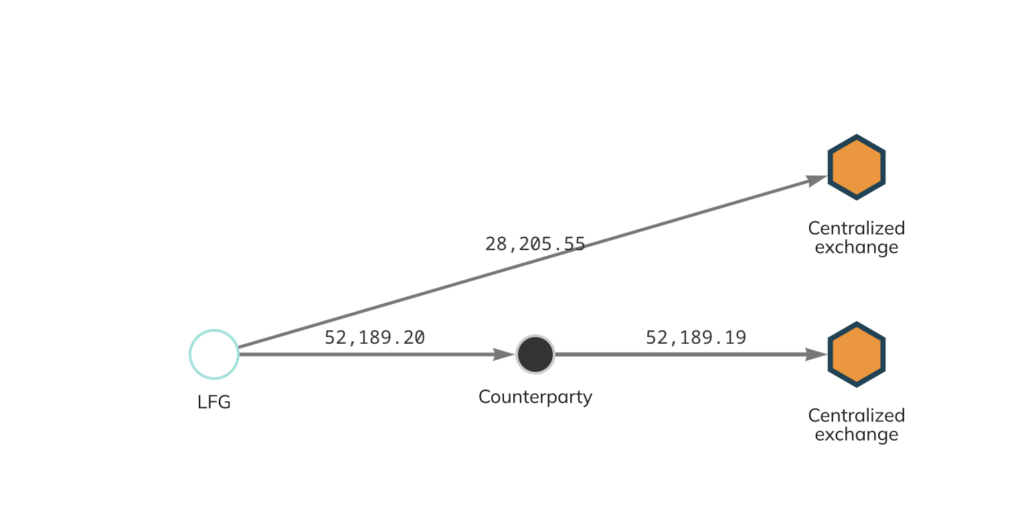
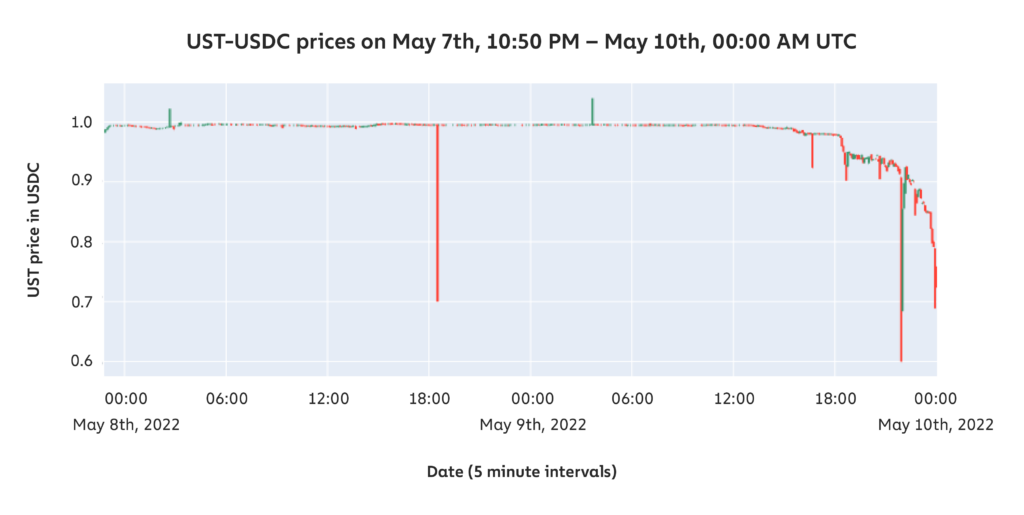
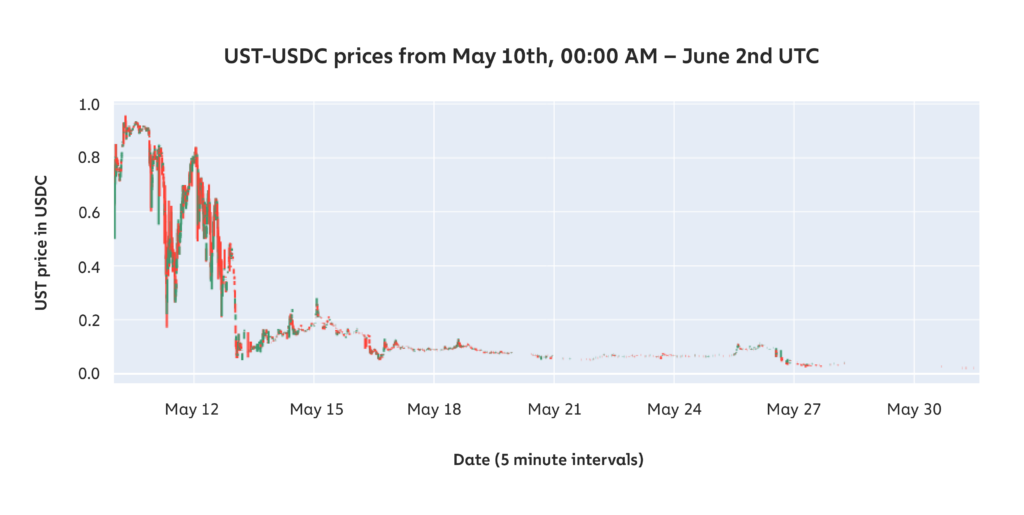
But by May 10th, LFG’s reserves were depleted and UST had again lost its peg – this time for good.
In a last ditch effort to stop the sell-off, multiple crypto exchanges suspended withdrawals.
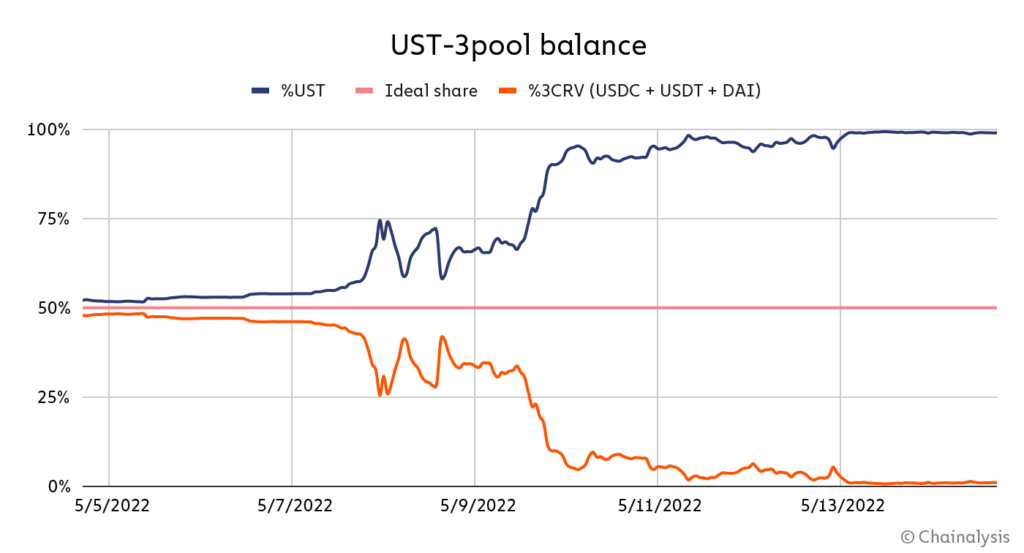
Meanwhile, UST’s largest liquidity pool was drying up. 3pool’s balance of UST to 3CRV – a “basket” of stablecoins that includes USDC, USDT, and DAI – was fast approaching 95% to 5%, far from the 50% to 50% ideal.
Only a single value-preserving exit remained. Per the stablecoin’s algorithm, a UST holder could always “burn” one UST to “mint” one dollar worth of LUNA, no matter the price of LUNA.
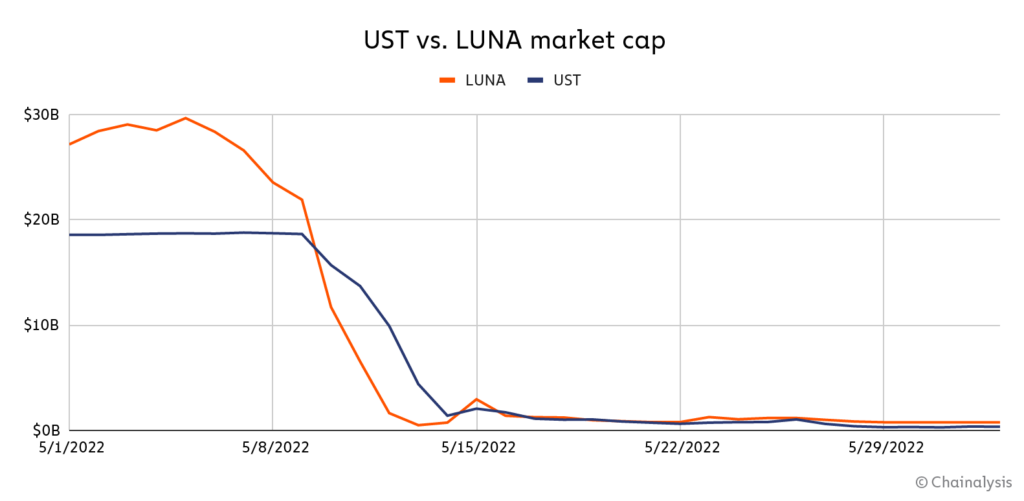
And so holders burned their UST en masse, hyperinflating LUNA. Supply entered the trillions; Prices fell to fractions of a cent. When LUNA’s market cap dipped below UST’s, it became clear that not everyone could burn UST for equal value.
The remaining holders sold at lower and lower prices until UST was worth little more than a penny. The algorithmic stablecoin had collapsed.
Undercollateralized vs. overcollateralized vs. fiat-backed stablecoins
Unlike most stablecoins, UST was algorithmic and undercollateralized. Rather than maintaining its peg by holding assets in reserves, Terraform Labs used a sister token, LUNA, to “absorb the price volatility of UST.” Other stablecoins are overcollateralized by cryptocurrency, like DAI. Borrowers must deposit $1.50 worth of ETH for every DAI they wish to borrow. Still others are fiat-backed and collateralized one-to-one, like USDC. Its reserves are held in cash and short-dated government treasuries.
Stablecoins also vary in their utility. Both the undercollateralized UST and the overcollateralized DAI serve DeFi, but fiat-backed stablecoins have other use-cases, too. They can help exchanges settle trades, migrants send remittances, and citizens of high-inflation countries store value. Tether recently launched a peso-backed stablecoin to facilitate remittances from Mexico, for example, and major stablecoins are quite popular among inflation-weary Argentines.
What were the macroeconomic impacts of the collapse?
UST and LUNA’s collapse didn’t happen in a vacuum. At the same time, several other crypto assets, including (BTC) and Ethereum (ETH), also declined in what some have said may be the beginning of a third crypto winter.
But was the UST’s collapse to blame for that decline? While it was definitely a factor, we find that because Bitcoin’s decline was so closely aligned with the downturn of non-crypto assets — especially tech stocks — its price action may have been more connected to the tech slump than UST’s crash.
Bitcoin’s correlation with tech stocks is a relatively new development. The graph below shows the correlation between Bitcoin’s price and that of several other asset classes in 2017.
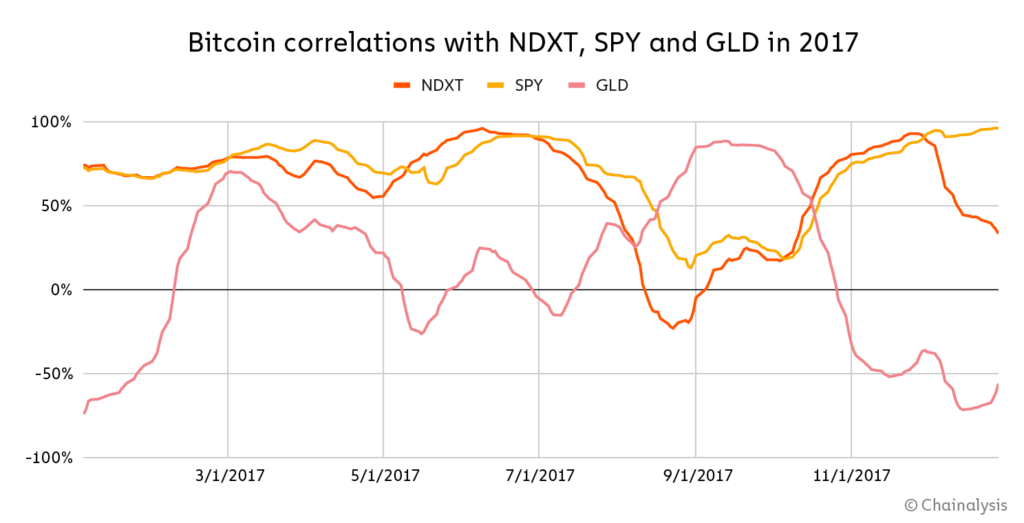
SPY: SPDR S&P 500 ETF Trust
GLD: SPDR Gold Shares
While there were “waves” of correlation, that is typical of assets with no significant relationship. This pattern bolstered the narrative that Bitcoin was uncorrelated and therefore a safe haven during market declines.
That narrative has become less tenable in 2022. Today, Bitcoin appears to move in concert with those assets.
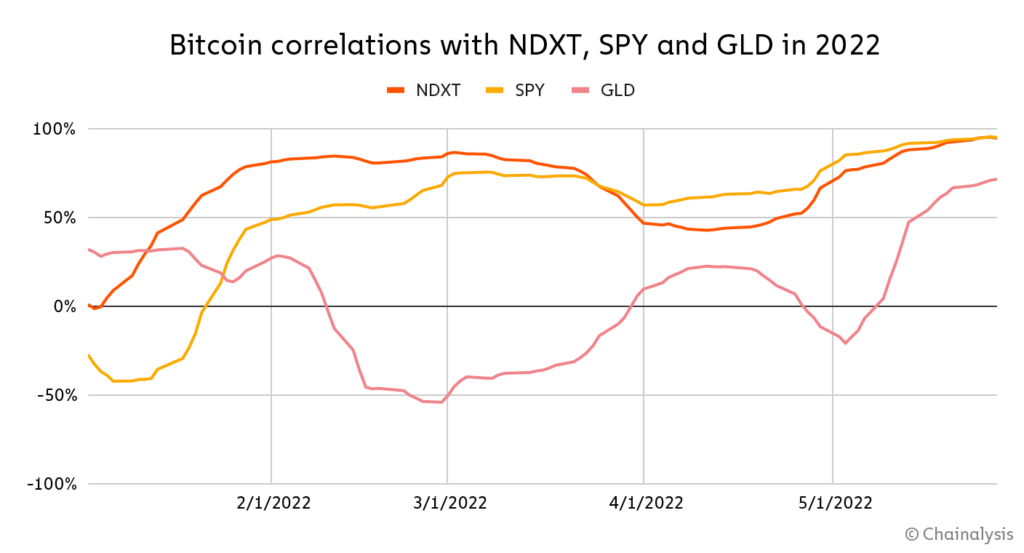
Bitcoin has maintained significant price correlations with NDXT and SPY this year while remaining uncorrelated with GLD. So, when NDXT and SPY began to fall, Bitcoin followed suit.
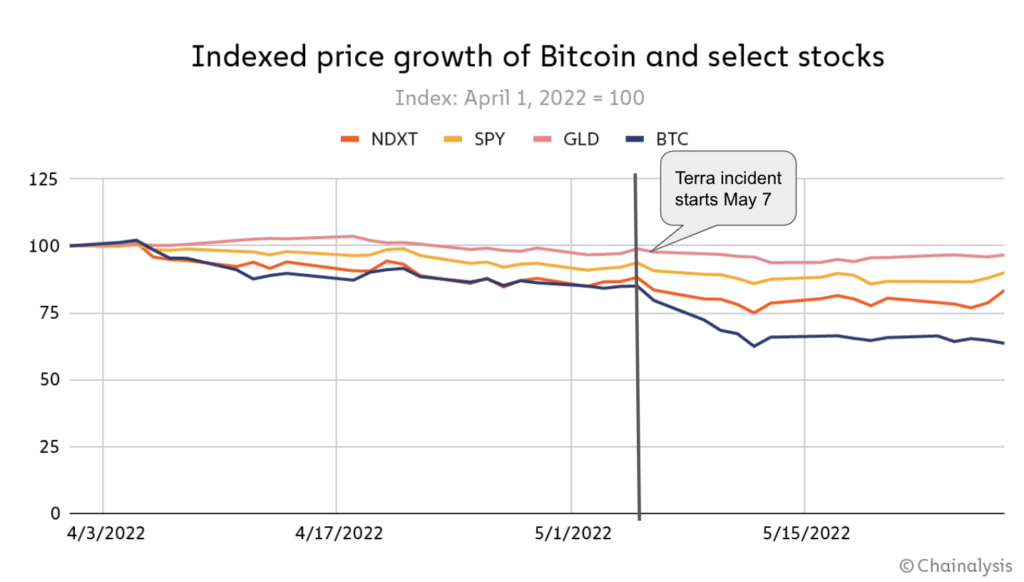
For a few days, however, the collapse of UST may have accelerated Bitcoin’s decline. This was expected — LFG sold billions worth of Bitcoin to repair the peg — but also short-lived. The accelerated decline ended around May 13 at roughly the close of UST’s collapse, at which point Bitcoin’s price action fell back in line with non-crypto tech assets.
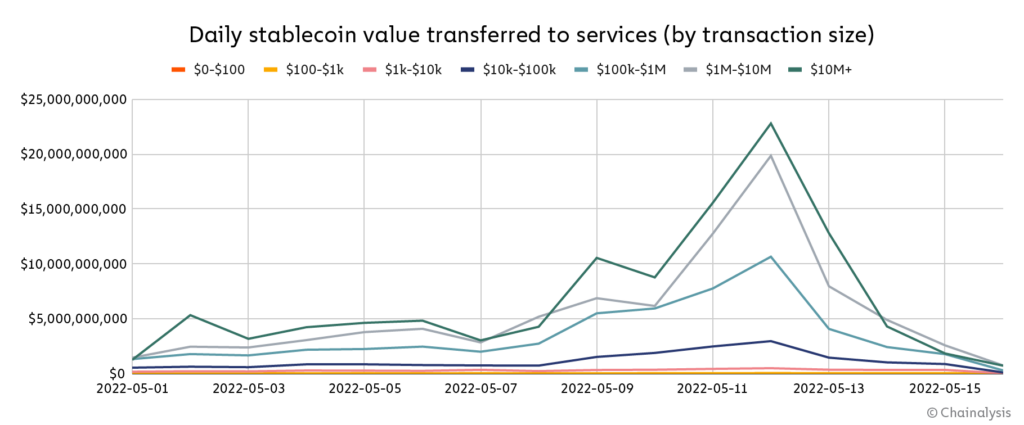
We also observed a spike in stablecoin redemptions during UST’s collapse. From May 9th to 12th, hundreds of billions more stablecoins than usual were sold for cash.
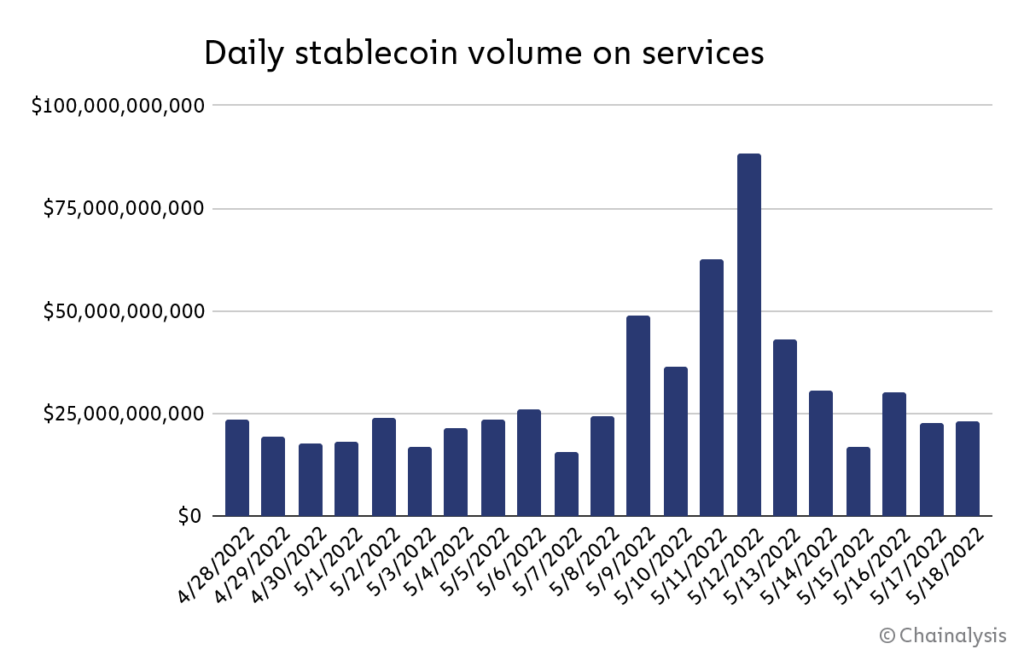
All kinds of investors sold their stablecoins during the crash, from big, institutional players to retail investors.
Redemptions peaked across all stablecoins — both algorithmic and asset-backed. This suggests that UST’s collapse scared investors away from stablecoins altogether, not just those of a certain class.
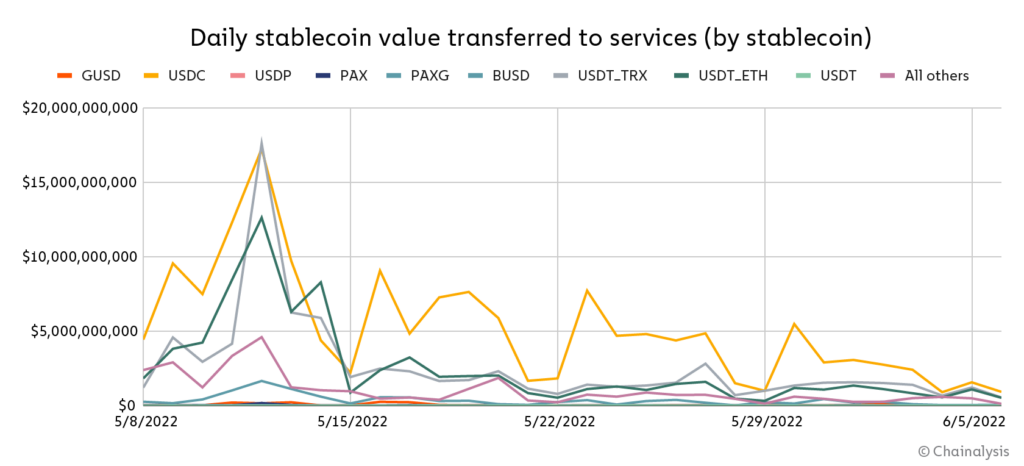
Nonetheless, major stablecoins weathered the storm. Though Tether briefly fell to $0.97 on May 12, it quickly rebounded and was able to process over $13 billion in redemptions of USDT over a week-long stretch.
Conclusion
UST’s collapse may pose a threat to consumer confidence in the short term and serve as a legislative catalyst in the long term, but it’s unlikely to stop the growth of responsible innovation in the crypto industry. Fortunately, thanks to blockchains’ transparency, we can learn from these incidents, educate others, and continue to build trust in cryptocurrency.
This analysis is a preview of our State of Web3 Report. Sign up here to download your copy!
This website contains links to third-party sites that are not under the control of Chainalysis, Inc. or its affiliates (collectively “Chainalysis”). Access to such information does not imply association with, endorsement of, approval of, or recommendation by Chainalysis of the site or its operators, and Chainalysis is not responsible for the products, services, or other content hosted therein.
This material is for informational purposes only, and is not intended to provide legal, tax, financial, or investment advice. Recipients should consult their own advisors before making these types of decisions. Chainalysis has no responsibility or liability for any decision made or any other acts or omissions in connection with Recipient’s use of this material.
Chainalysis does not guarantee or warrant the accuracy, completeness, timeliness, suitability or validity of the information in this report and will not be responsible for any claim attributable to errors, omissions, or other inaccuracies of any part of such material.