
Earlier this year, we shared insights from our analysis of the bitcoin money supply, which revealed long-term investors sold approximately $24 billion¹ of bitcoin to new speculators between December 2017 and April 2018, with half of this activity occurring in December alone. This unprecedented injection of liquidity served as a fundamental driver behind the price decline during the same period.
Today, we’re excited to provide freshly updated data (through August 2018) and discuss our central takeaway: that bitcoin investors and speculators have held their positions over the summer. Before we review the key findings, let’s briefly cover how we map the monetary aggregates and why we believe it’s valuable to maintain this unique data set.
What we are doing: combining our dataset of blockchain activity with money supply analysis
Chainalysis clusters² the bitcoin blockchain based on patterns and a variety of heuristics. Through these clusters, we can understand types of users, which allows us to define the money supply according to monetary aggregates. The concept of standardized monetary aggregates has its roots in traditional economics. The Federal Reserve, for example, tracks various measures of U.S. dollar money supply and their relationships with important economic variables, including GDP growth and inflation.
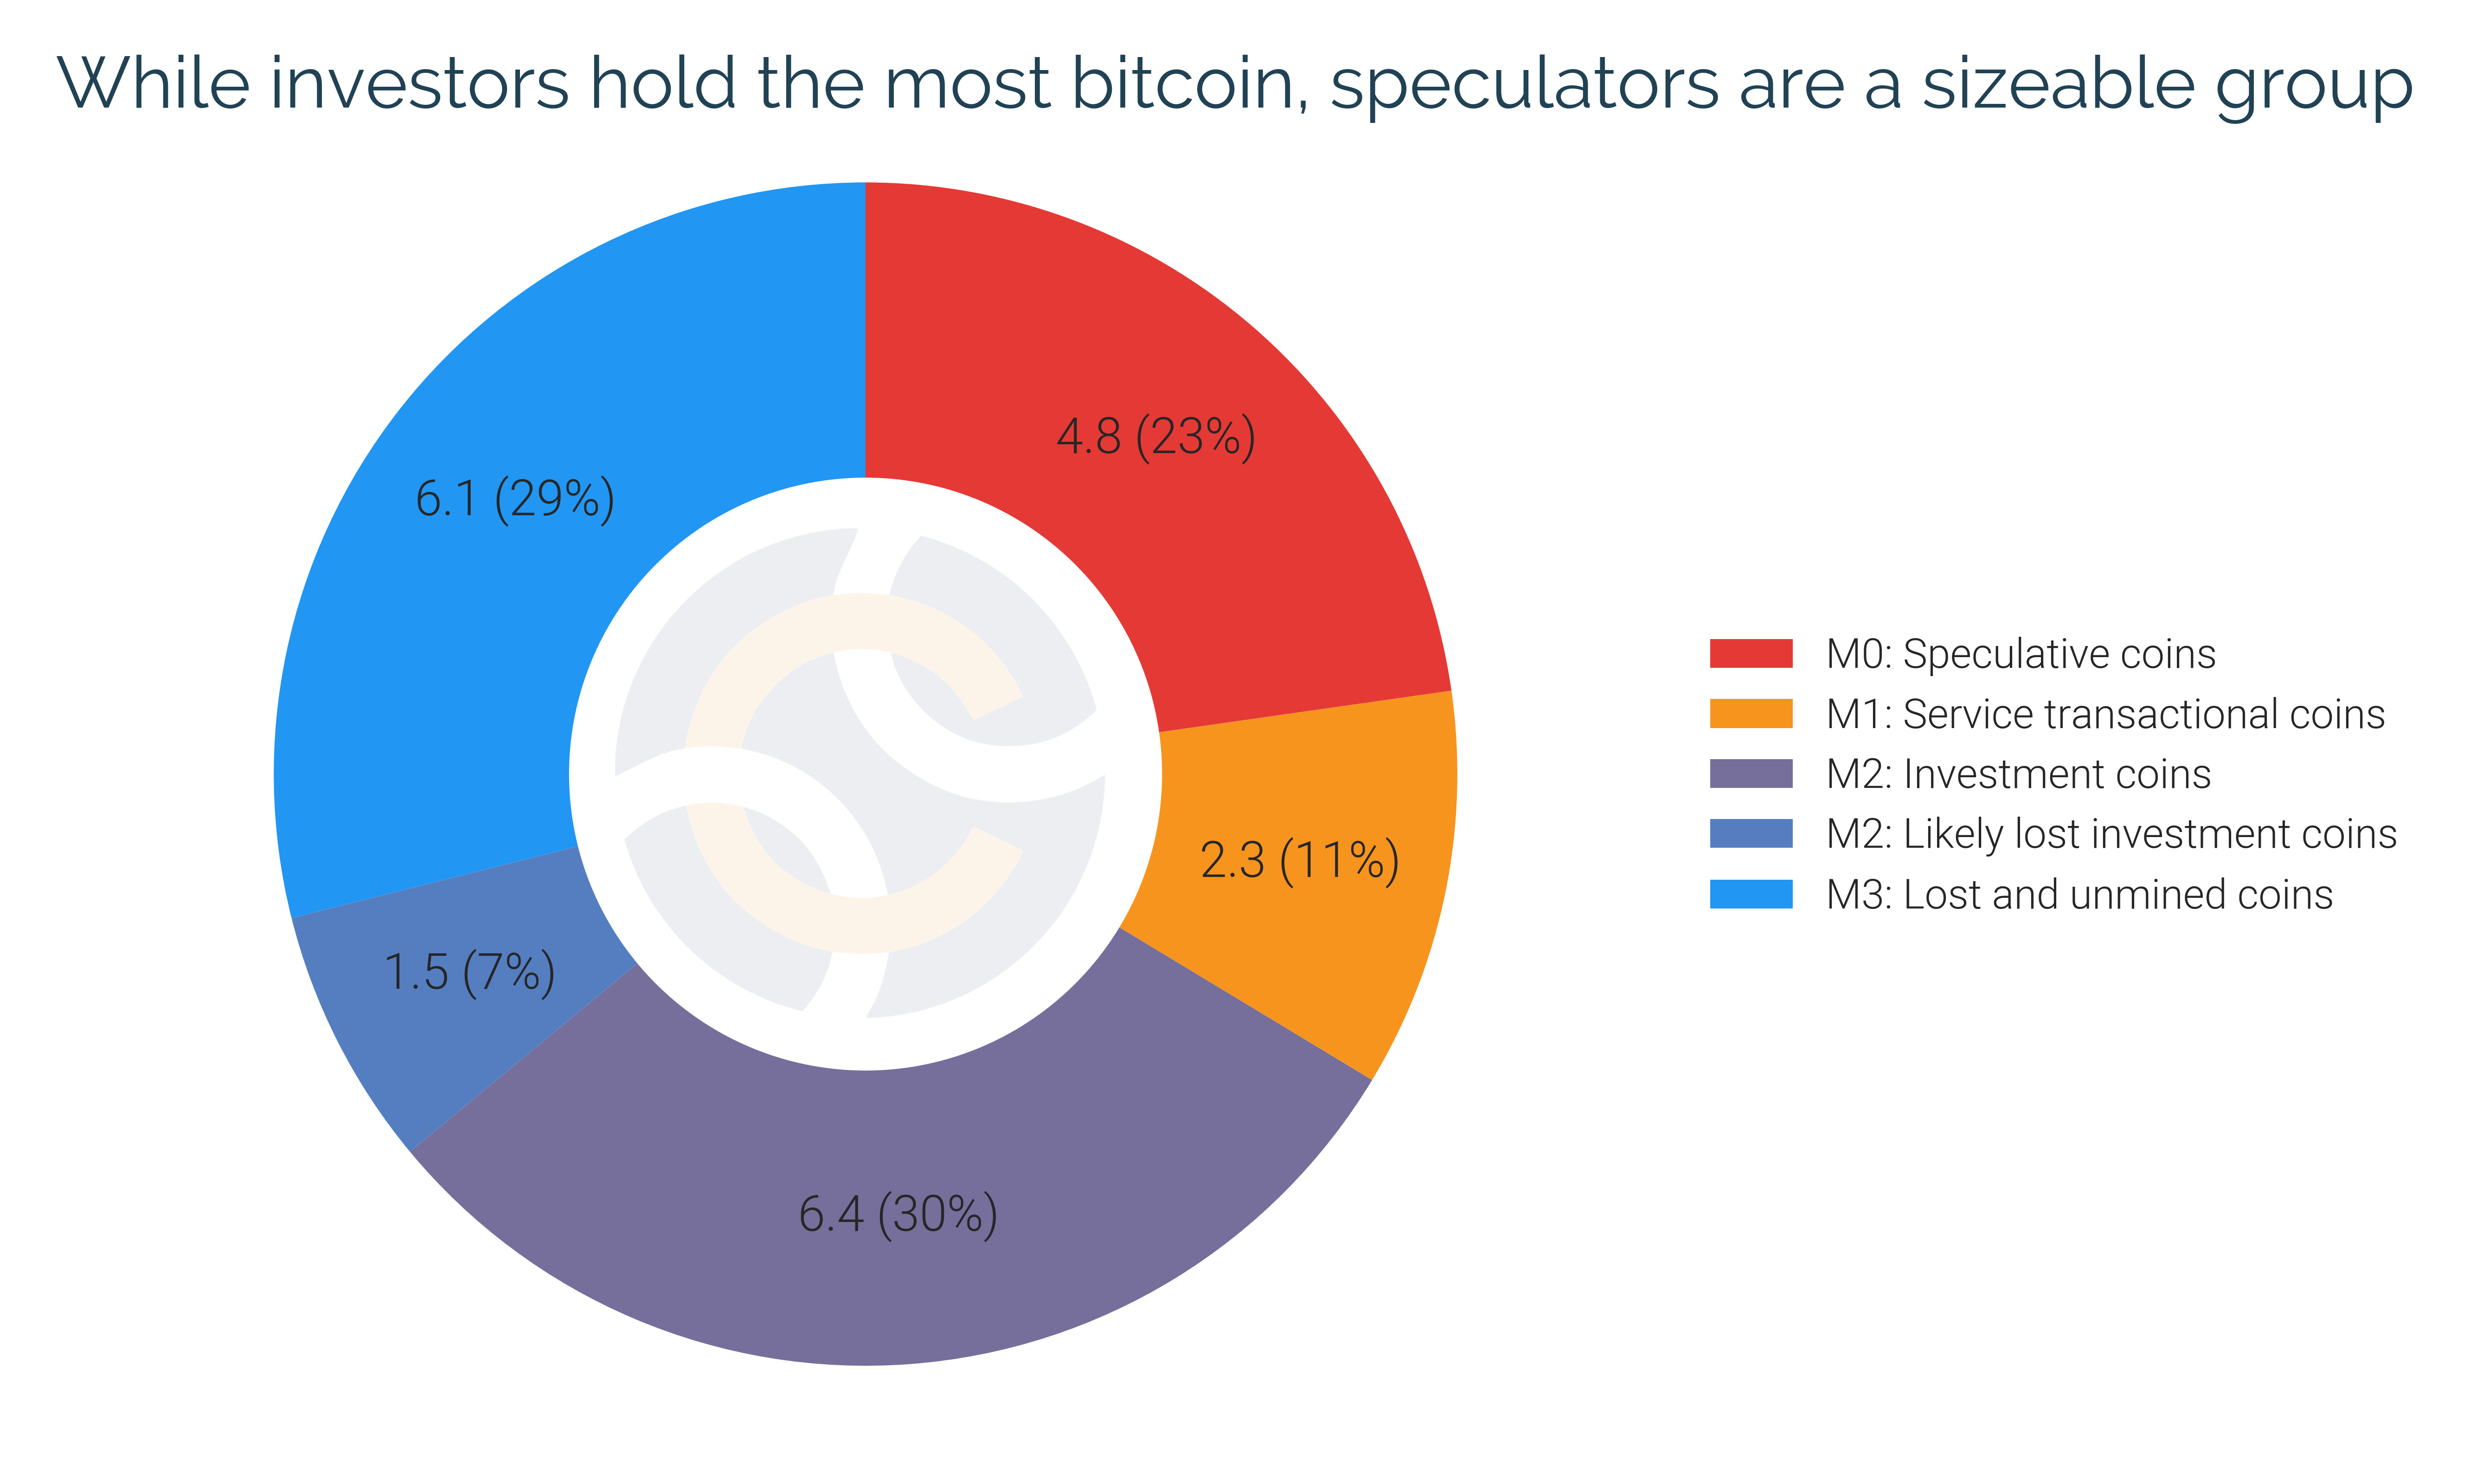
With bitcoin, we can categorize coins from the most liquid (speculative coins and those used by services for transactions), to less liquid bitcoin (coins held for investment, including by long-term HODLers and new investors), and the least liquid (coins that are lost or yet to be mined). More specifically, we can categorize the money supply into monetary aggregates known as M0, the most liquid category, through M3, the least liquid. Our most recent mapping of these monetary aggregates to bitcoin is shown below.
Why we do it: to build a better understanding of the crypto-economy
For emerging financial systems, such as the crypto-economy, building an understanding of the underlying economic signals is a key factor in empowering participants to make more informed decisions. People are simply less likely to stay in, and are less well served by, a market that appears random and based on hype. If we can identify and monitor clear signals —and those signals are logical— more people will feel comfortable investing. That’s where data can play an important role.
At Chainalysis, our unique data sets allow us to develop a nuanced understanding of different types of investors. Rather than guessing the nature of anonymous addresses, we can analyze bitcoin across multiple categories, including “speculators” and “investors.” We can also estimate the amount of lost coins.
Key findings from our updated data
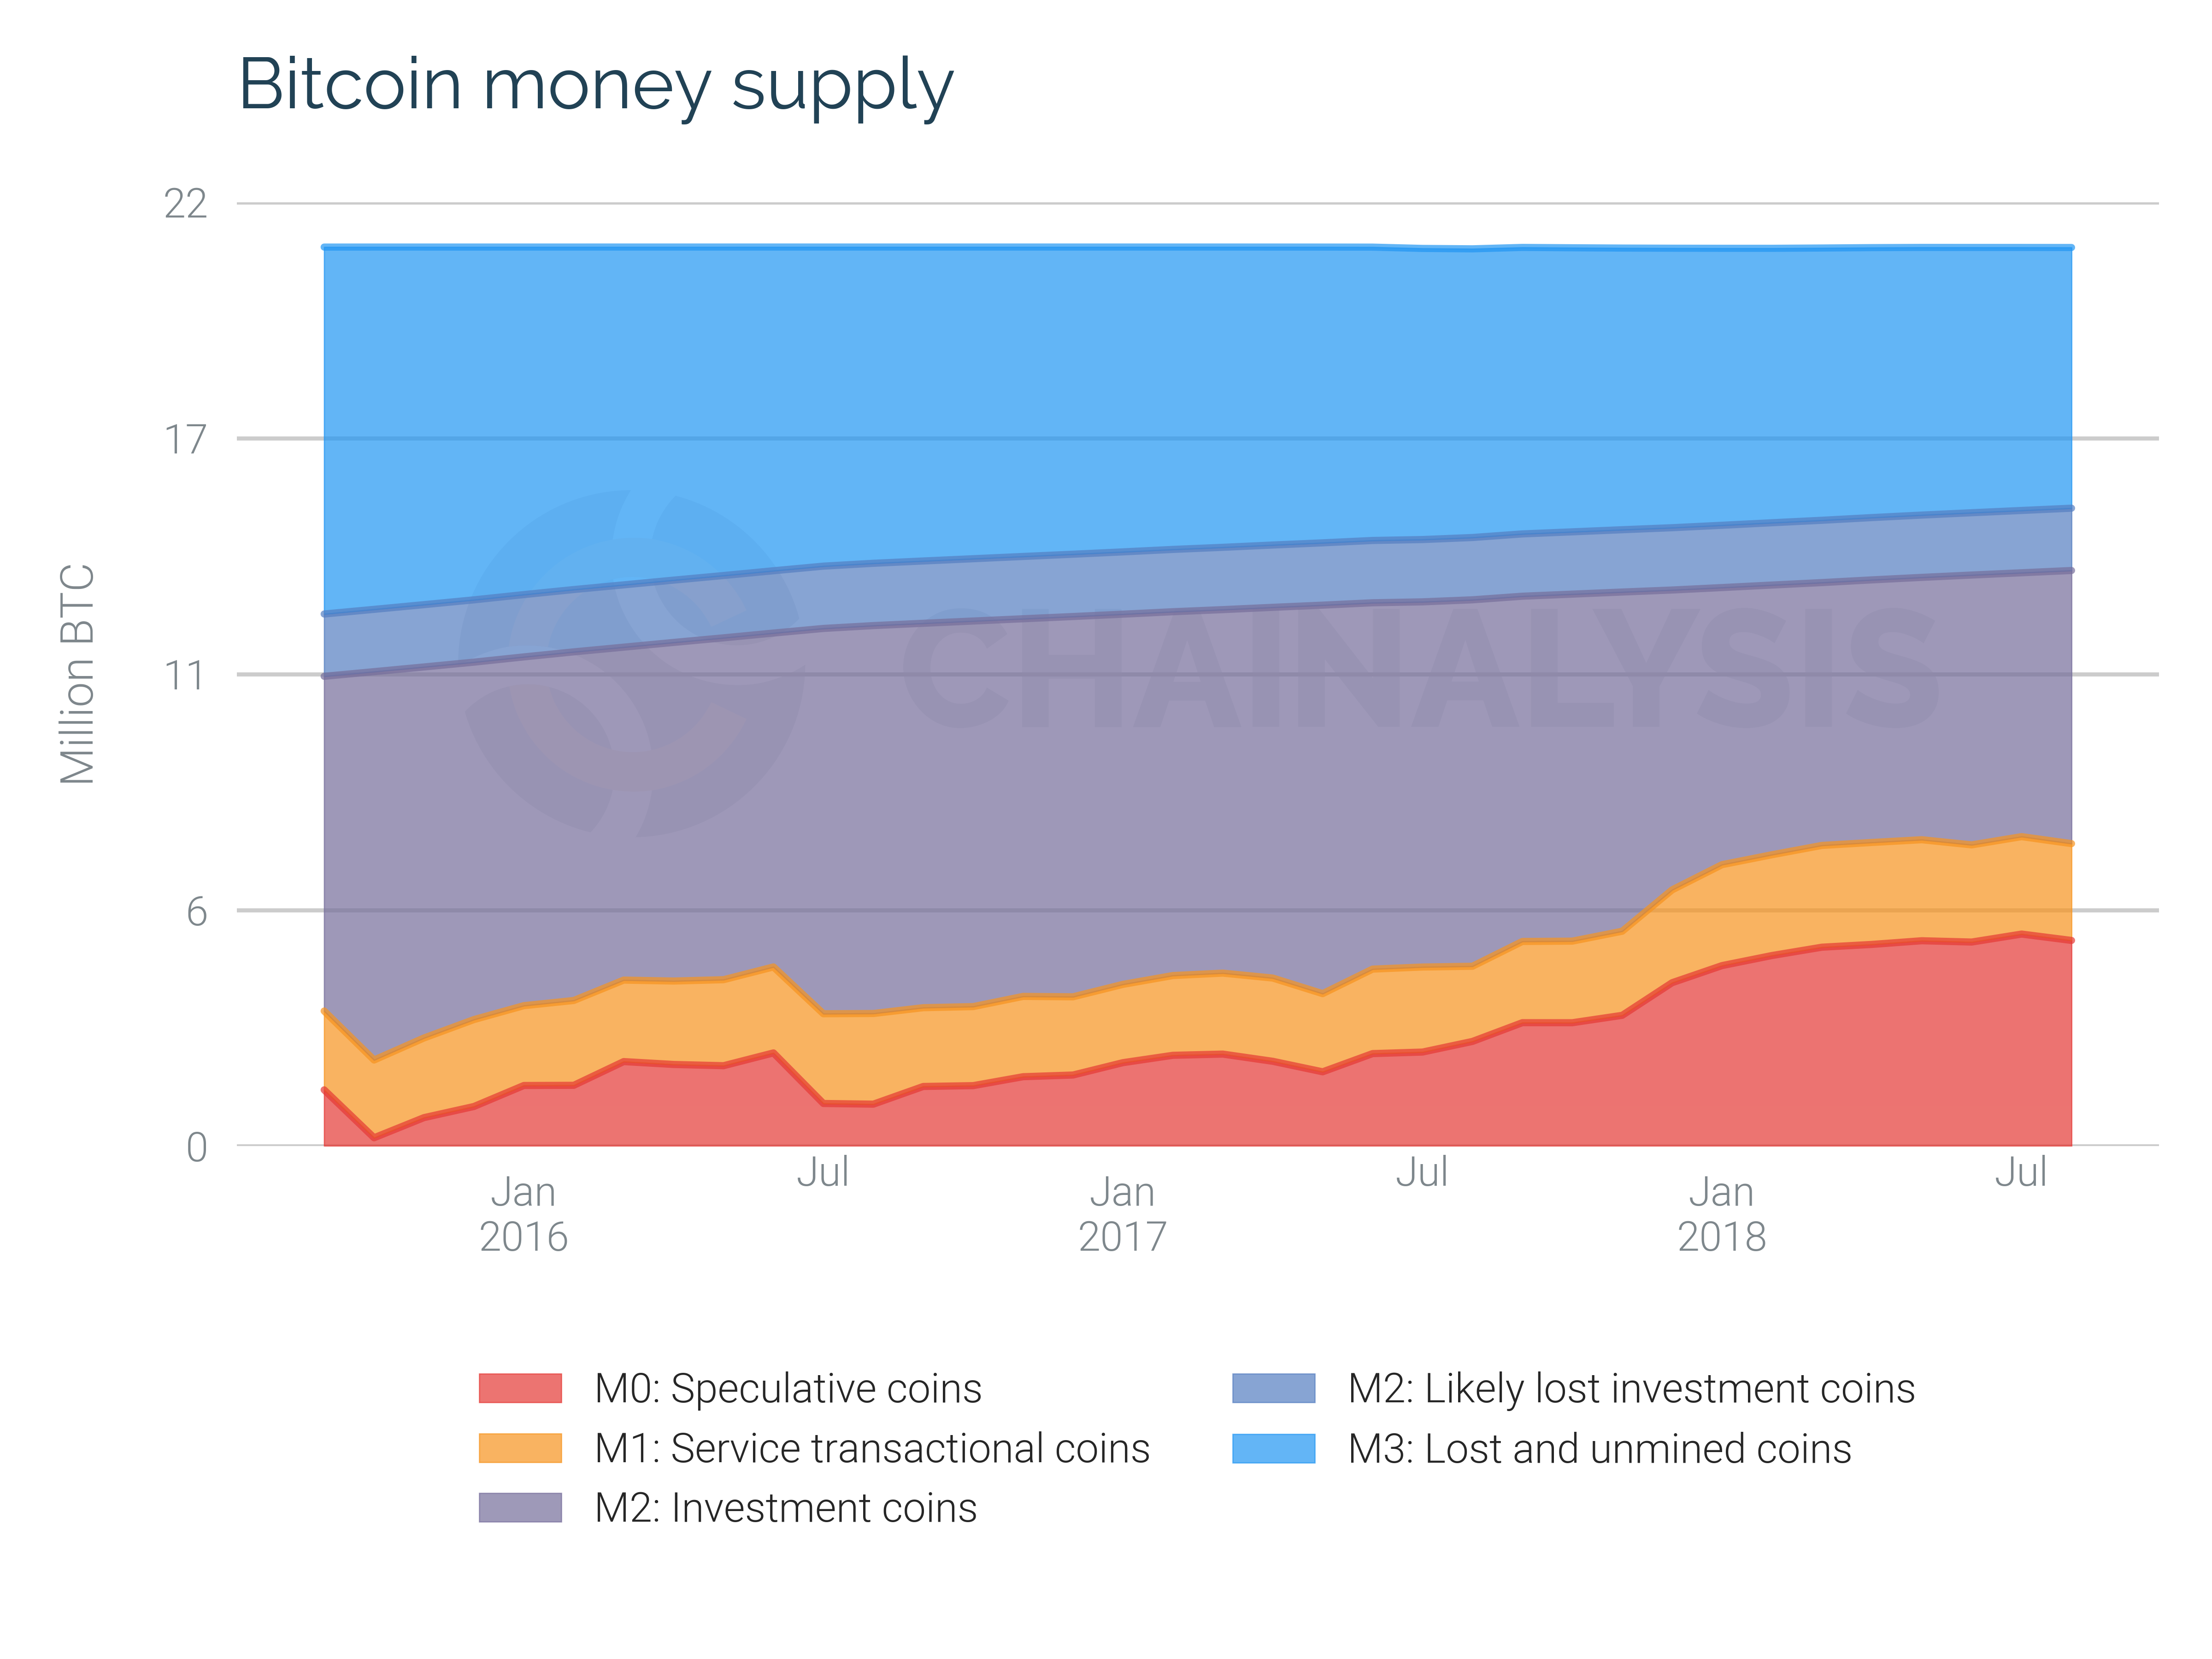
When we reviewed our initial data —which was exclusively reported in the Financial Times— we saw major changes to the defined monetary aggregates: Over the December 2017 to April 2018 period, new speculators (M0) flooded the market, while long-term investors (M2) liquidated at higher valuations.
Our updated data covers a few more months, through August 2018, and reveals marked stability in each of the monetary aggregates. As shown below, all the monetary aggregates have been extremely steady over the summer months. Specifically, the amount of bitcoin held for speculation (M0) has remained stable between May and August at around 22% of available bitcoin. Similarly, the amount of bitcoin held for investment remained stable during the summer at around 30%.
In our view, this is a sign of a market less sensitive to hype, where each news item does not have the ability to significantly push bitcoin prices up or down. Instead, the market seems to have recalibrated after the entry of so many new market participants with different beliefs and expectations than those who held bitcoin prior to 2017.
Neither long-term investors nor new speculators have changed their positions much this summer. This suggests that the market will make a major move, for better or worse, only in response to a fundamental change. For example, restrictive regulation, new use cases, or technology improvements —such as the lightning network— could act as catalysts of change. Regardless, the continued presence of both long-term investors and new speculators suggests that bitcoin has maintained the growth in its user base from year-end 2017. As such, the first challenge of adoption —getting cryptocurrency into people’s hands— has been overcome, but we are now waiting to see what the next stage of adoption looks like.
For more research-driven insights, check out our report on Tether and our recent take on global regulatory compliance and anti-money laundering in the cryptocurrency world.
____________________________________________________________________________________________
1) In our June report, we found that long-term investors sold ~$30 billion of bitcoin. As we learn more about transactions on the blockchain, our accuracy improves. In this case, people we identified as speculators now look, given more time to observe them, like new long-term investors.
2) At Chainalysis, our fundamental unit of the crypto economy is the cluster. A cluster is our best estimation of the addresses included in a single entity’s wallet. We create clusters by analyzing the blockchain data of a cryptocurrency using a set of rules that take into consideration properties such as spending patterns, address relationships, and transaction structure (to name a few).