
Blockchain analysis isn’t just useful for investigations and compliance. It can also help us analyze cryptocurrency markets to uncover patterns in usage and inform investment decisions. It’s a unique benefit of cryptocurrency as a new asset class, since these insights can only be derived because most cryptocurrency transfers are recorded on transparent ledgers.
If you’re wondering what kinds of market insights we can draw from blockchain analysis, look no further. Below, we provide a data-driven overview of Bitcoin ownership and trading, including the users and exchanges that determine how Bitcoin moves around the larger cryptocurrency ecosystem.
Most Bitcoin is held for long term investment
The first question we need to ask: what are people using Bitcoin for?
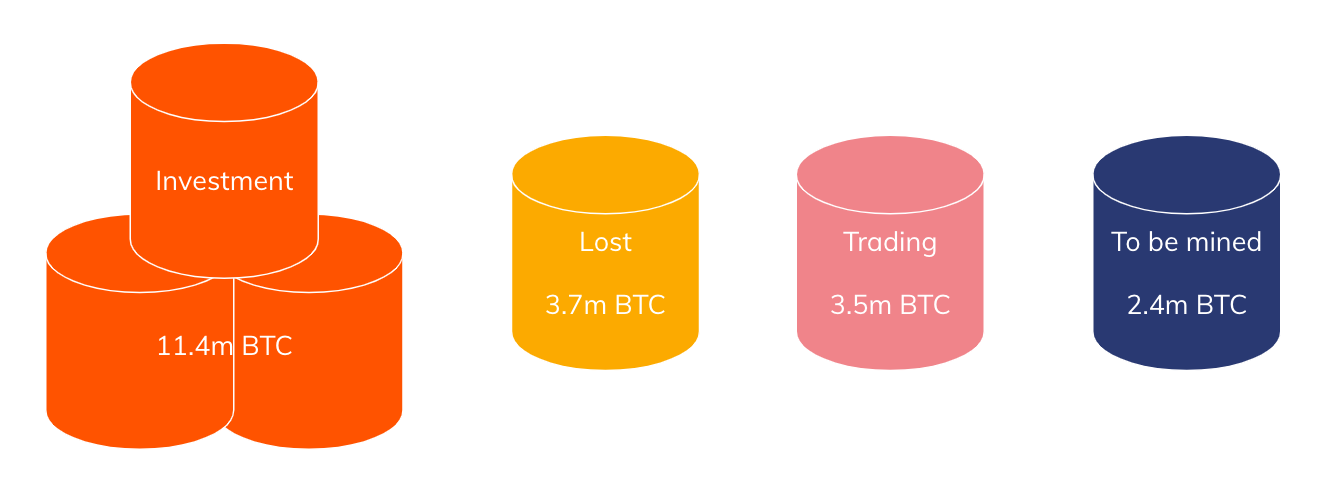
As of June 2020, roughly 18.6 million Bitcoin has been mined. We break that 18.6 million Bitcoin down into three buckets based on its movements to date:
- Roughly 60% of that Bitcoin is held by entities — either people or businesses — that have never sold more than 25% of Bitcoin they’ve ever received, and have often held on to that Bitcoin for many years, which we label as Bitcoin held for long-term investment.
- Another 20% hasn’t moved from its current set of addresses in five years or longer. We consider this lost Bitcoin.
- That leaves just 3.5 million Bitcoin — or 19% of all mined Bitcoin — that moves frequently, primarily between exchanges, which we label as Bitcoin used for trading.
The data shows that the majority of Bitcoin is held by those who treat it as digital gold: an asset to be held for the long term. But this digital gold is supported by an active trading market for those who prefer to buy and sell frequently. The 3.5 million Bitcoin used for trading supplies the market, and, in interaction with the level of demand, determines the price. With more people looking to trade Bitcoin, which is only becoming more scarce following the recent halving, Bitcoin moving from the investment bucket (or potentially even the lost bucket if the earliest adopters still have their private keys) into the trading bucket could become a crucial source of liquidity. However, one would expect this will only happen if Bitcoin’s price rises to a level at which long-term investors are willing to sell.
Most traders are retail but pros move the most value
Our next question: how many people are trading that 3.5 million Bitcoin and who are they? While we estimate that tens of millions of people hold Bitcoin and over 5 million visit exchange websites each week, on-chain data reveals that throughout 2020, a maximum of 340,000 people are active Bitcoin traders on a weekly basis. And while we obviously can’t identify individual traders, we can break them down into two categories based on the USD size of the transfers they send to exchanges: retail and professional.
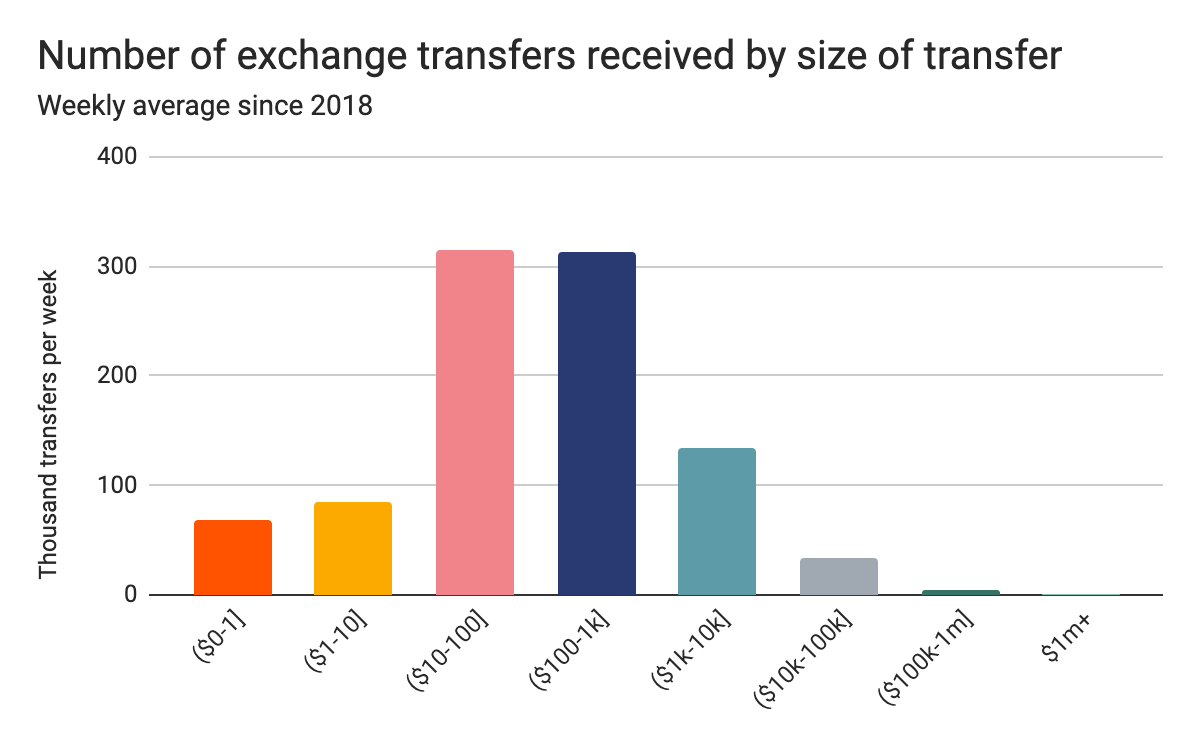
Retail traders, whom we categorize as those who deposit less than $10,000 USD worth of Bitcoin on exchanges at a time, appear to be the large majority, accounting for 96% of all transfers sent to exchanges on an average weekly basis.
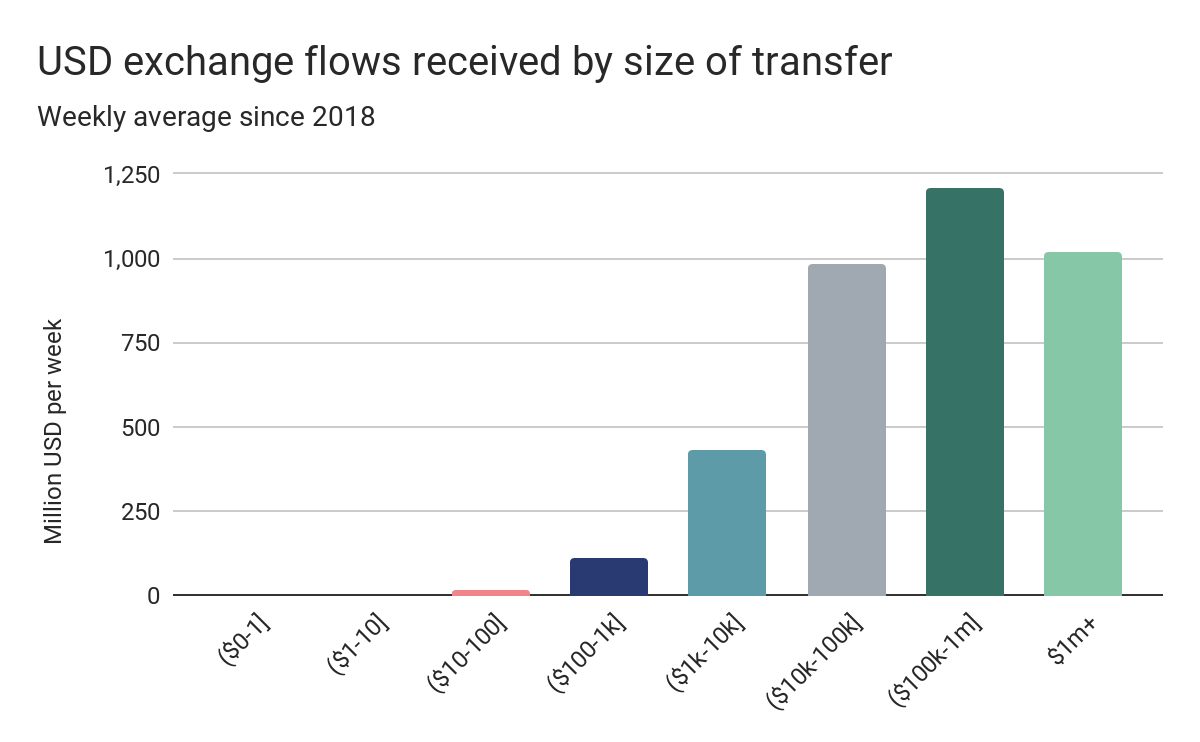
Professional traders, however, control the liquidity of the market, accounting for 85% of all the USD value of Bitcoin value sent to exchanges. Because of this, professional traders are the most significant contributors to large market movements, such as those seen during Bitcoin’s dramatic price decline in March as the Covid-19 crisis intensified in North America. However, professional traders are few in number, moving all that value in just 39,000 transfers per week on average in 2020.
A small group of exchanges dominate
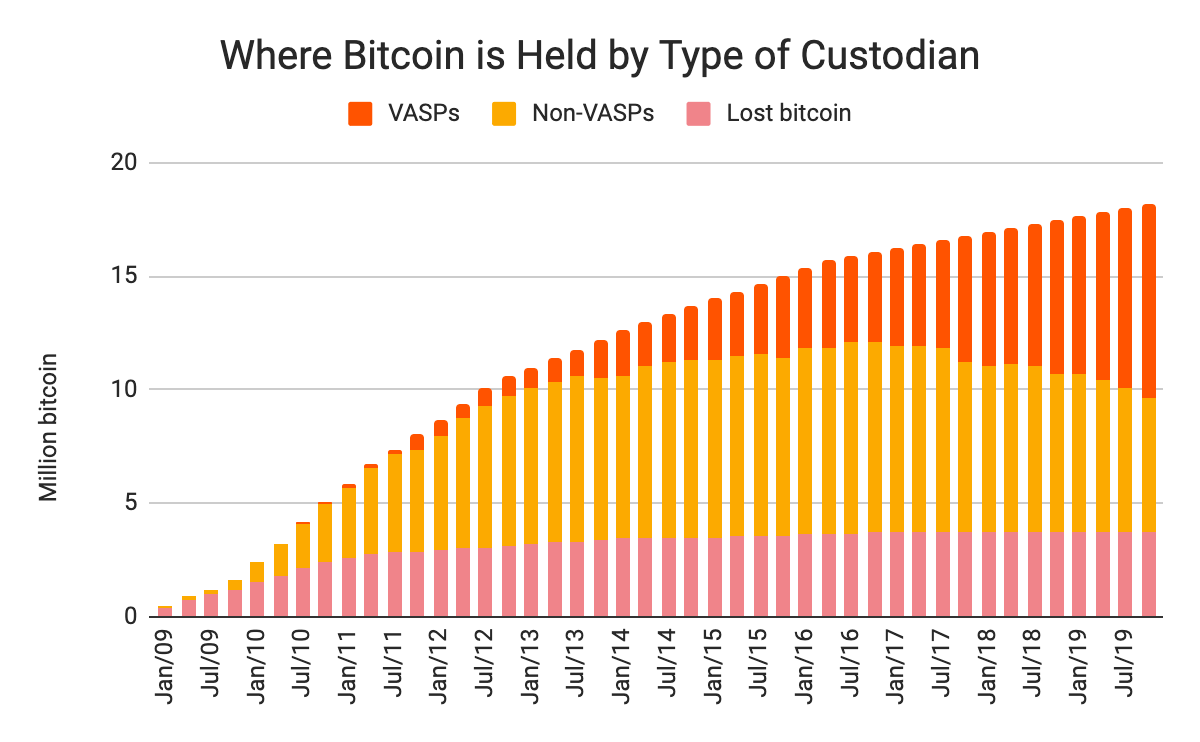
Where does most Bitcoin sit today? Roughly 60% of Bitcoin that is not lost is held by a licensed custodial service, or as FATF would refer to it, a Virtual Asset Service Provider (VASP). Most cryptocurrency exchanges would fall into this category, along with hosted wallets. As we can see, this share has risen steadily over time, reflecting the growth of custodial cryptocurrency businesses as Bitcoin has gone more mainstream. The dominance of VASPs becomes even clearer when we consider that, of the remaining 40% of available Bitcoin, which is not currently held by VASPs, 87% has passed through a VASP at some point. Most people either hold their Bitcoin on VASPs, or acquire their Bitcoin from VASPs.
Exchanges, as the centers of cryptocurrency trading and a popular place to store Bitcoin, are unsurprisingly the dominant VASP when it comes to Bitcoin flows. In 2020 on average, 1.8 million Bitcoin, worth $14.4 billion, is transferred per week in total. 40% of this moves directly between exchanges within a week, while 43% of Bitcoin flows through intermediary addresses between VASPs, primarily between exchanges.
Drilling down further, we see how much the biggest exchanges dominate these flows.
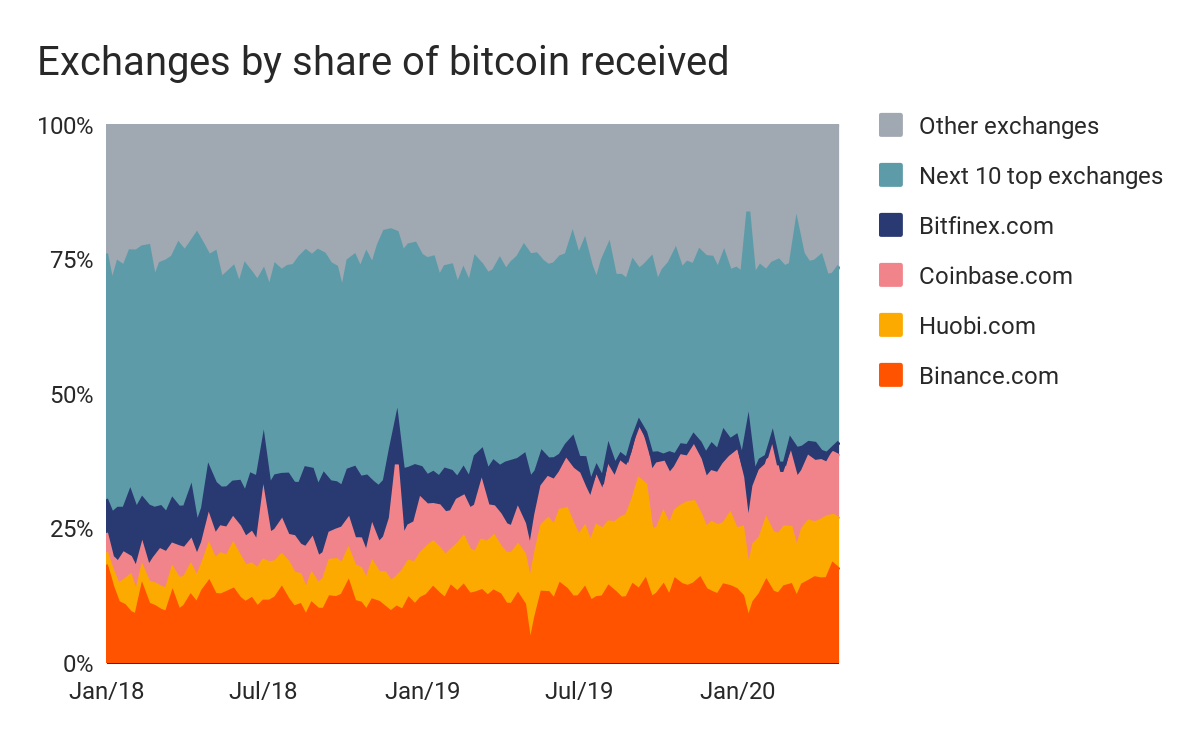
The four largest exchanges since 2018 — Binance, Huobi, Coinbase, and Bitfinex — took in 40% of all Bitcoin received by exchanges in 2020. The next ten received 36% collectively, leaving hundreds of other small exchanges to duke it out over the remaining 24% of transfer volume.
The findings get even more interesting when we break activity down by other qualitative exchange characteristics. For instance, if we break down exchange flows by exchange support for fiat currency, we see how important exchanges that allow on and off-ramping to cryptocurrency are to the overall ecosystem.
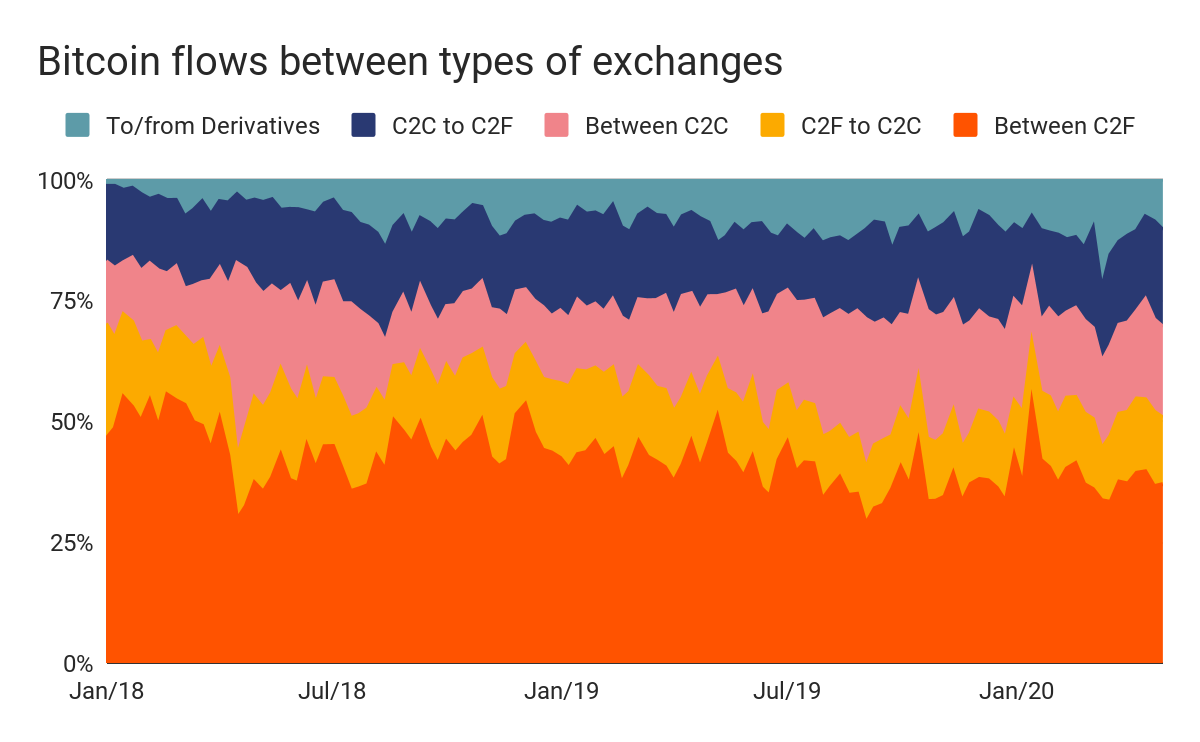
Above, we break down the flows between the following types of exchanges: those allowing only crypto-to-crypto (C2C) transfers, those allowing crypto-to-fiat (C2F) transfers and vice versa, and those solely providing cryptocurrency derivative trading. On-chain transfers between C2F exchanges make up by far the largest share of activity at 42% of all Bitcoin flowing between exchanges, with those between C2C exchanges making up just 18%. When we factor in transfers between C2F and C2C exchanges, we see that C2F exchanges are a counterparty in 74% of all exchange transfers by volume.
Why do C2F exchanges dominate? While we can’t say for certain, our hypothesis is that C2F exchanges have greater liquidity because they’re the exchanges where most users first purchase cryptocurrency, so they are the source of new demand. C2F exchanges are also where users trade Bitcoin for fiat, which means that even those who prefer C2C exchanges would often have to use C2F exchanges to cash out. If their function as on and off-ramps gives C2F exchanges greater liquidity, that could also create a self-reinforcing cycle in which more traders are attracted in order to take advantage, thereby further increasing liquidity.
Finally, we can also compare exchanges based on how often a Bitcoin deposited at an exchange is traded within that exchange. For this analysis, we’ve come up with a metric called trade intensity, which is the ratio between the number of times Bitcoin is traded on the exchange’s central order book (based on exchange’s’ self-reported trading data), and the Bitcoin the exchange receives on-chain (i.e. Bitcoin moving into the exchange from outside). We’ve previously used this metric to investigate whether exchanges are faking trade volume (though we hadn’t yet coined the term “trade intensity”).
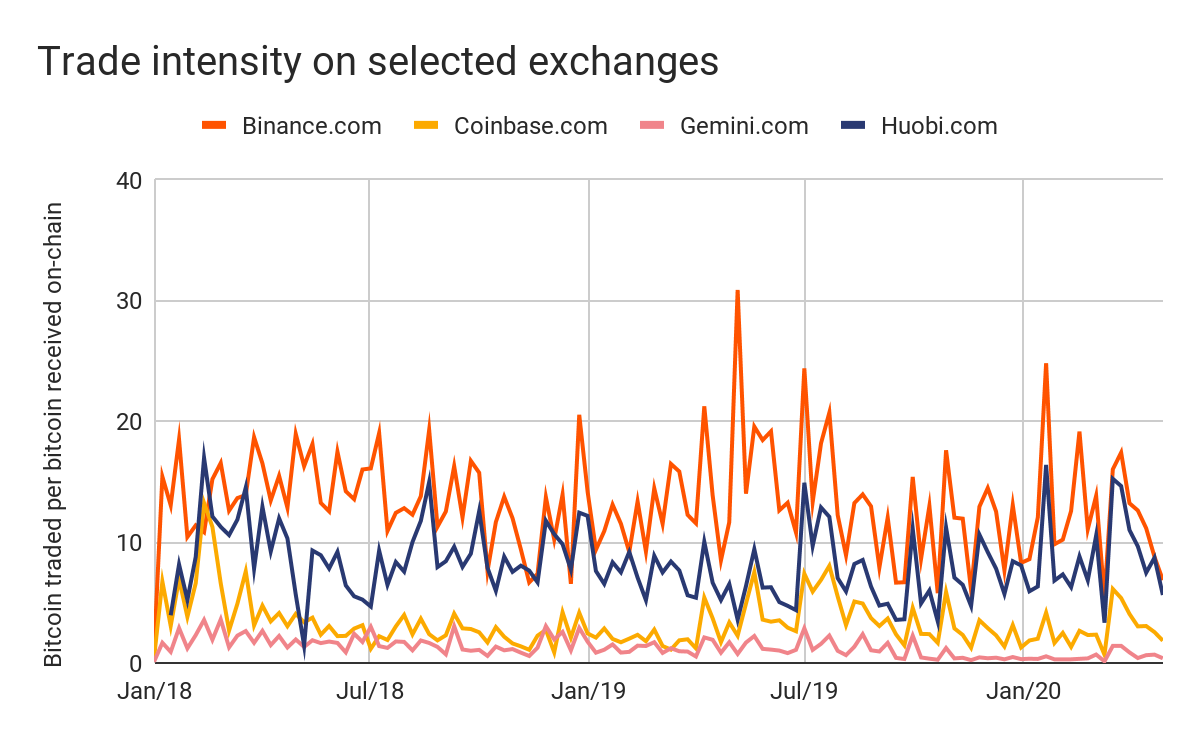
It may come as a surprise that there’s a large variance in trade intensity between exchanges. Above, we compare a few of the top exchanges, and see that Binance leads the way with an average trade intensity of 14 since 2018. Again, that means each Bitcoin deposited at Binance in that time period is traded an average of 14 times on Binance’s order book. Huobi is next in our group with a trade intensity of 8, followed by Coinbase with 3 and Gemini with 1.
We believe there are a few factors that can contribute to higher trade intensity. One is the number of other cryptocurrencies that Bitcoin can be traded with on an exchange. The greater the number, the more a Bitcoin will be traded back and forth. Higher trade intensity also indicates more traders are keeping their assets on the exchange long term, rather than moving assets on to the exchange to trade before moving them off again. On the flip side, lower trade intensity can be the result of users storing Bitcoin on the exchange rather than using it as a trading venue. Also, exchanges facilitating OTC trading often have lower trade intensity as well, as their trades aren’t recorded in spot trading data.
Blockchain analysis for markets is just getting started
As you can see, blockchain analysis can tell us a lot about cryptocurrency use cases, the state of the cryptocurrency market, businesses, and trading patterns. It will be interesting to see innovative new applications of this data for market intelligence as cryptocurrency continues to gain popularity, more funds flow in, and investors get more sophisticated. If you’d like to learn more about these findings, listen to Chainalysis Chief Economist Philip Gradwell’s recent appearance on the Flippening Podcast.