TL;DR: Chainalysis has used its unique data and insights to analyse the bitcoin price decline from December to February; which was caused by sell-offs of Bitcoin on exchanges. We believe this activity was primarily driven by:
- Regulatory news driving trading volumes and a peak of positive sentiment pushing price; and
- A lack of fundamentals[1] resulting in herding behaviour across increasingly correlated exchanges and cryptocurrencies.
On 17 December, the price of Bitcoin reached nearly $20,000, by 6 February it had fallen 70% to nearly $6,000. While there are many theories as to the causes of this massive price decline, Chainalysis analysis suggests the price rise and fall was driven by sentiment, as it moved through peak positivity, and regulatory announcements, which affected trading volumes.
The price fluctuations were so severe due to the lack of fundamental economic indicators to anchor falling expectations. Traditional markets have an established set of market fundamentals that help investors understand and contextualize price and volume fluctuations. The cryptocurrency world is still figuring out the correct fundamentals to use in situations of massive price volatility. Price fluctuations, therefore, assume a more extreme pattern, as the market tests the bounds of investor sentiment.
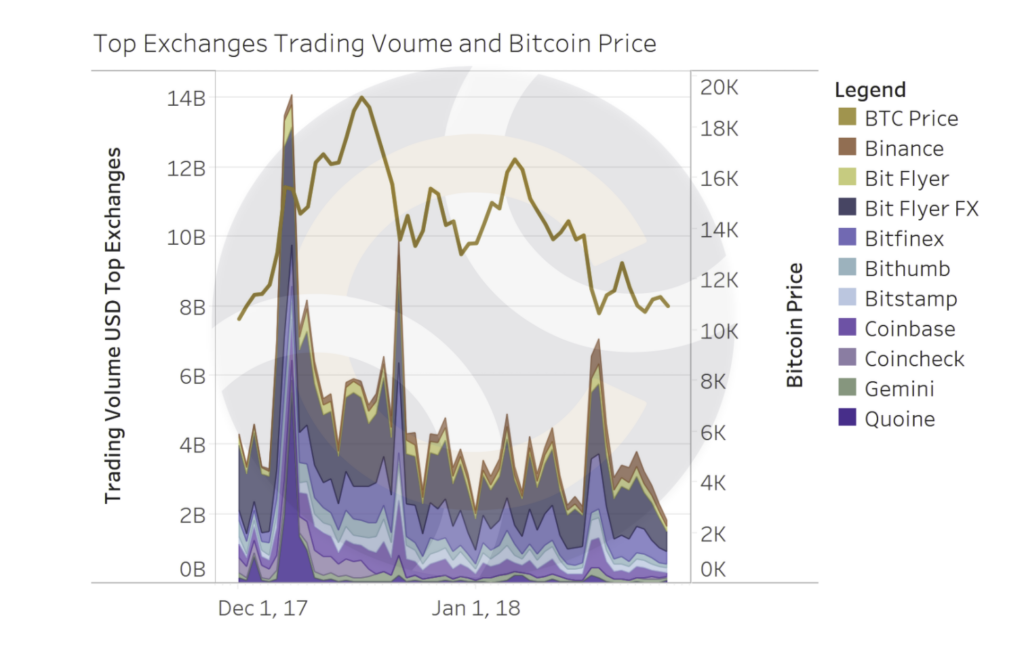
Trading volumes were sensitive to regulatory news, while price was driven by sentiment
Throughout December, trading volume of Bitcoin surged to two separate peaks following major announcements in South Korea and Russia. On 7 December, South Korea banned financial institutions from offering Bitcoin, triggering a 90% increase in trading volumes on the ten largest exchanges. Then, on 21 December, Russia announced it would soon release cryptocurrency regulation. Overall, trading volumes were 2.5 times higher in December relative to November and accounted for over 40% of the total 2017 trade volume.
 Source: CryptoCompare
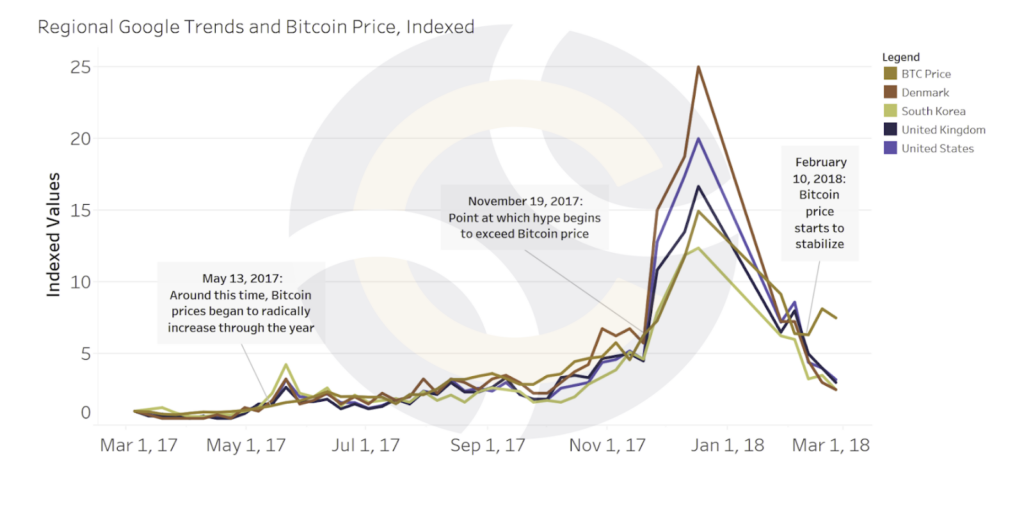
Hype around the world started to grow during this time, particularly in the US and Europe. Many exchanges were forced to suspend new client registrations during December due to excessive demand. For the first time since mid-2017, Google searches of “Bitcoin” – a leading proxy measure for cryptocurrency interest – grew at a faster rate than the price, particularly in the US. Typically, Google trends lag Bitcoin prices, but the reversal in December 2017 highlights the importance of hype in driving the price peak.
 Source: CryptoCompare
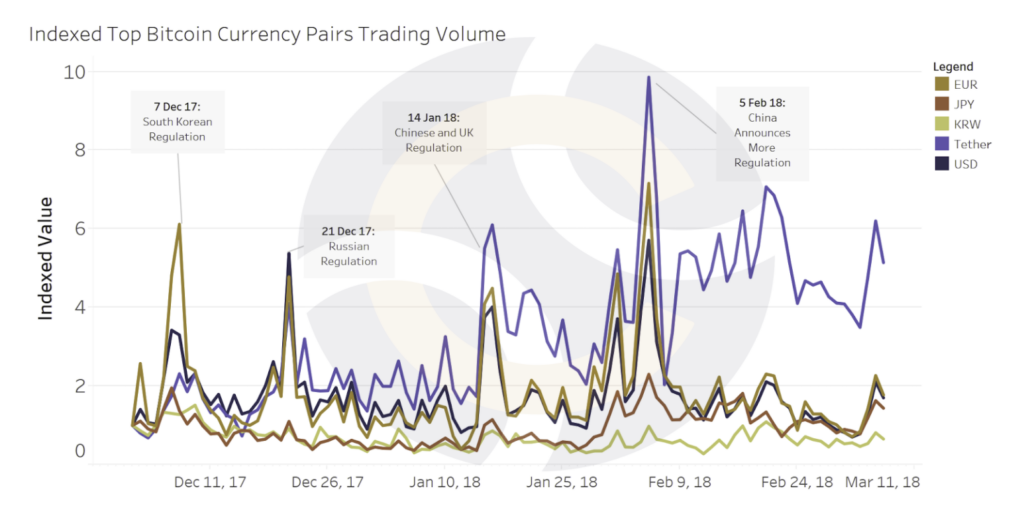
With regulatory announcements coming from South Korea, China, and Russia, trading volume surged the most in the USD/BTC, EUR/BTC, USDT/BTC and JPY/BTC currency pairs. Since December, it is clear that a geographical shift has taken place. It is likely that, with greater South Korean regulation and the continuing fall out from the closure of Chinese exchanges in September, traders have found new homes dealing crypto for USD, EUR, USDT (Tether) and JPY. Indeed, Chinese-based exchange Huobi’s top trades are denominated in USDT.
 Source: CryptoCompare
The price decline was severe as traders followed one another down, without the anchor of market fundamentals
The Bitcoin price volatility was so extreme as there are no fundamental economic indicators to provide investors with a way to contextualize price movements. In the stock market, a price correction is defined as a decline of at least 10% and a bear market is a decline of over 30%. Between 17 December and 6 February, the Bitcoin price declined by 70%. As investors tried to figure out the financial and economic principles that affect cryptocurrencies, December and January was characterized by largely baffled speculators, spooked new retail investors, and a few whales using these facts to move the market in their favor.
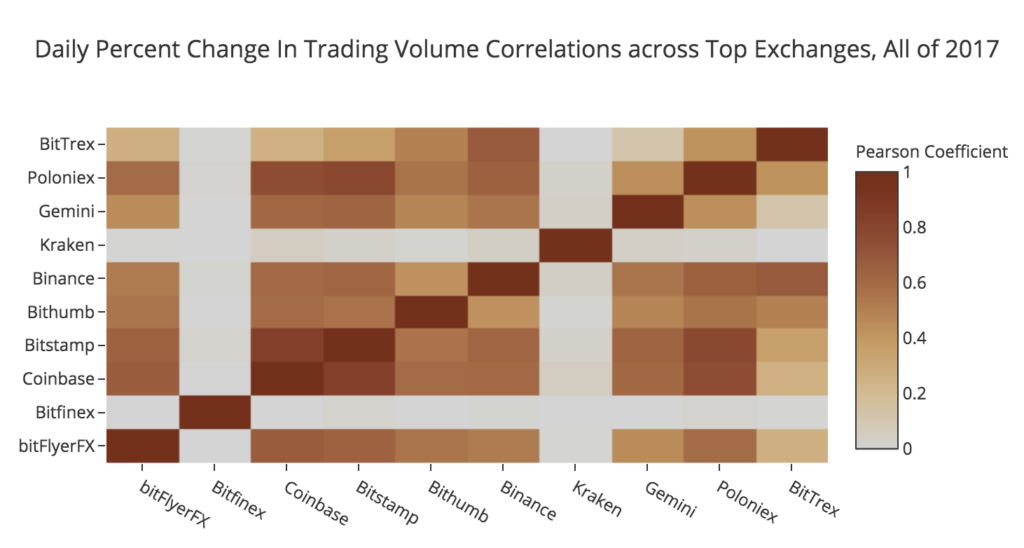
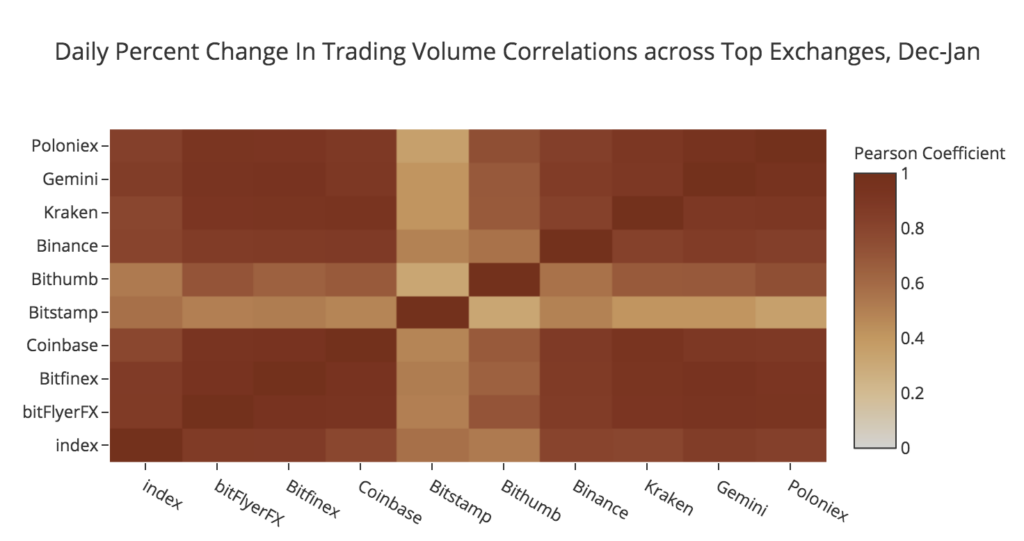
Price volatility has become further accentuated as trading volumes across exchanges have become highly correlated. As a result, changes on one exchange creates momentum across the market. This was illustrated by the resumption of trading on Kraken on 13 January, after a multi-day technical upgrade. Pent-up trading activity on Kraken led to a price decline, which spread rapidly across exchanges. The correlation between exchanges has increased over time, as the two figures below show. Darker reds indicate greater positive correlation between pairs of exchanges on the vertical and horizontal axes. The figure on the top is for all of 2017, while the figure on the bottom, which shows much greater correlation across all exchange pairs, is for December 2017 to January 2018. This increasing correlation likely reflects the increasing sophistication of traders and automated trading bots, which take advantage of price differences between exchanges, and in doing so reduce those price differences.
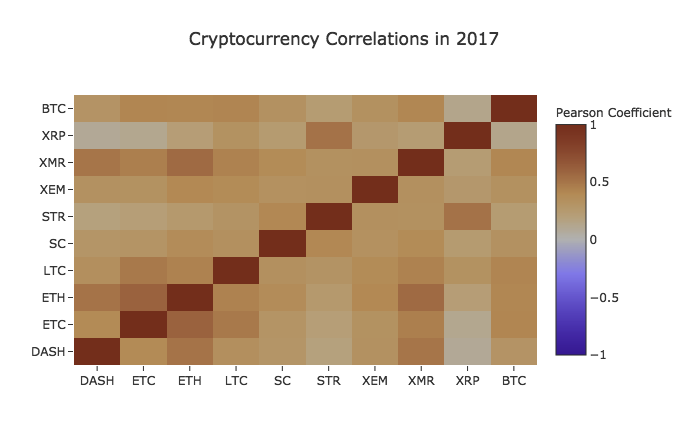
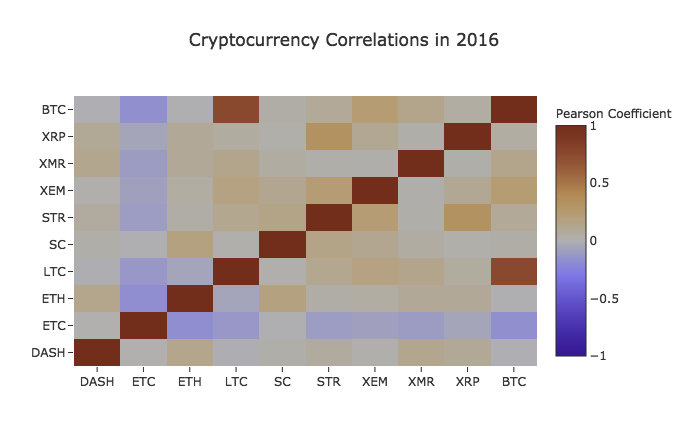
Altcoin prices are also increasingly correlated with Bitcoin prices. This is shown in the two figures below, where reds indicate a positive correlation and blues indicate an inverse correlation. The top figure shows the correlation in prices across cryptos in 2016, and on the bottom in 2017, demonstrating the increasing positive correlation. As a consequence of greater coin correlation, the Bitcoin price decline rippled across all cryptocurrencies. Bitcoin was the leading indicator and declined first after 17 December, with the rest of the cryptocurrencies beginning to fall on 20 December.
Net inflows of Bitcoin to exchanges are strongly associated with Bitcoin price movements
Between the time of the first trading volume spike on 7 December and the spike on 22 December, exchanges were receiving more Bitcoin than they were sending. When an exchange receives more Bitcoin to its wallets than are being sent out, there is a ‘net inflow’ of Bitcoin to the exchange. The chart below shows the net Bitcoin flow to exchanges and reveals that the price peaks through December were accompanied by an influx of Bitcoin supply on the exchanges [2]. As a consequence, supply was increasing at a greater rate than demand, and therefore the high price levels could not be sustained.
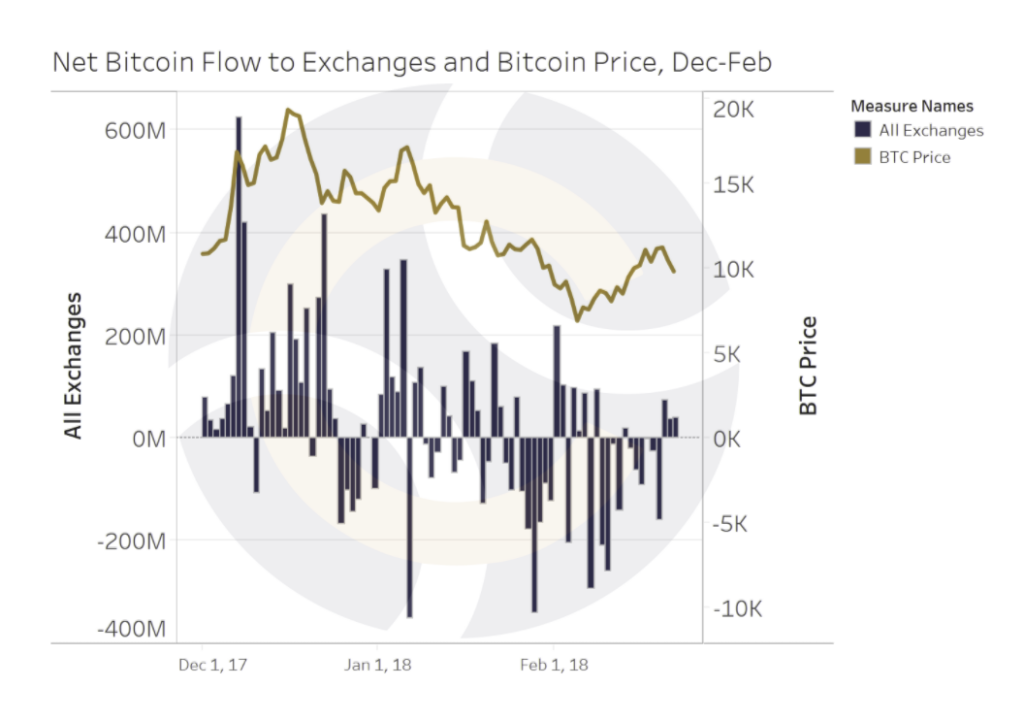
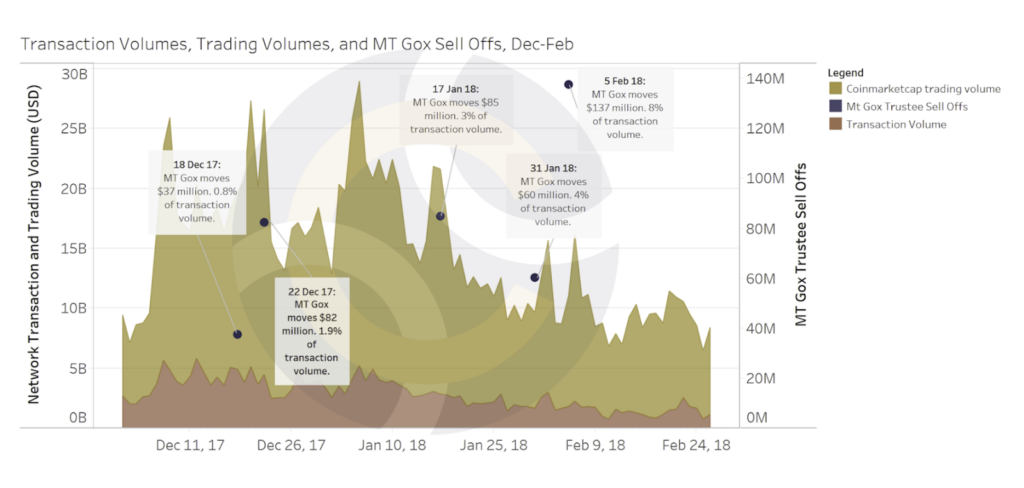
The MT Gox trustee recently started bulk sell offs of Bitcoin directly on exchanges, further revealing how sensitive the Bitcoin price can be to shocks to supply. As shown below, MT Gox coins started to be released on 18 December – around the time of the price peak – on Japanese, US, and European exchanges, including Bitflyer and Kraken. While this accounted for less than 1% of network transaction volume, by 5 February, the MT Gox sell offs counted for nearly 8% of network transaction volume, at which point the Bitcoin price was in a sustained decline.
 For Bitcoin’s price activity to even out, economic fundamentals must be established to ground sentiment.All markets are underpinned with some degree of volatility based on speculation, but without indicators and market principles, price cycles will continue to hit record highs and lows as the market undergoes natural shocks to supply and demand. As these principles are established, the cryptocurrency market will stabilize and reach a sustainable equilibrium.
Glossary
- Market fundamentals refer to principles upon which traders make informed decisions using technical analysis as opposed to speculation. In capital markets, important market fundamentals that traders use are: volatility indices, price momentum, market capitalization measures, and earnings ratios; to name a few. Market fundamentals are based on qualitative and quantitative metrics of underlying value, providing both insight into the usefulness of an asset and the future potential performance of that asset.
- Chainalysis tracks transactions on the network of Bitcoins to and from exchanges via its proprietary analysis of the blockchain.