
We’re excited to announce today the launch of three subscription options to Market Intel, a data-driven product that provides powerful insights into cryptocurrency markets. Built on Chainalysis’s trusted, proprietary data platform, Market Intel enables you to leverage on-chain data to research and execute cryptocurrency investment strategies with confidence. You can access a sample Market Intel dataset here and sign up for the weekly Market Intel Report in which Chainalysis Chief Economist Philip Gradwell breaks down the most significant shifts in on-chain cryptocurrency flows and tells you what they mean for the market as a whole.
Want to get more acquainted with Market Intel in the meantime? Keep reading. Below, we’ll break down five of the most useful Market Intel metrics and show you how they reveal actionable trends in cryptocurrency markets.
Total flows
Total flows refers to the total value transferred over time on a given cryptocurrency’s blockchain between different entities, such as self-hosted wallets, exchanges, and other services. This metric tracks every dollar of value that changes hands on the blockchain. Imagine seeing how all the cash in an economy is spent! This is impossible for traditional assets but is possible for cryptocurrencies due to their transparency and the intelligence that Chainalysis adds to blockchain data.
The chart below shows the source and destination of all Bitcoin that has been sent since the start of 2019. You can see that much Bitcoin moves between self-hosted wallets. These are private wallets, such as you might have on your phone, or the wallets of institutions that choose to hold their cryptocurrency themselves.
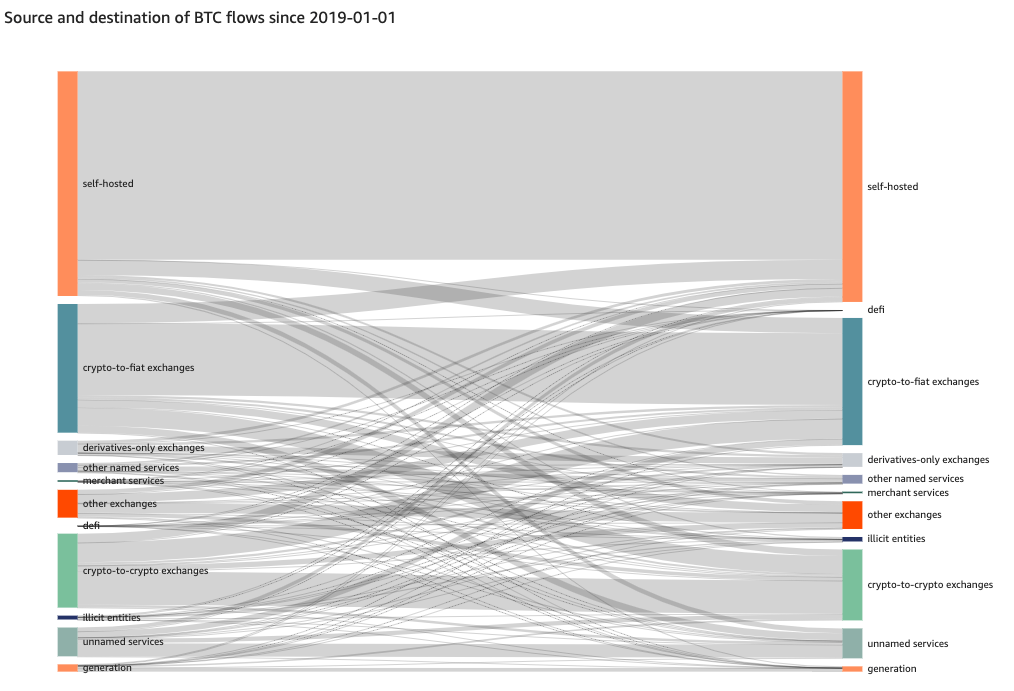
There are also large flows of Bitcoin between different types of exchanges: crypto-to-fiat exchanges, where crypto can be traded for fiat currencies, such as US dollars, and crypto-to-crypto exchanges, where cryptocurrencies are traded primarily for other cryptocurrencies. While this is the case for Bitcoin, the same chart for Ethereum shows that DeFi and decentralized exchanges dominate Ether flows.
Total flows is a metric with many uses. As it shows the total value transferred and the type of activity that value is flowing between, it can be used to size the market for a cryptocurrency. As we’ll explore later, delving into the specific types of services and entities that account for an increase in total flows can reveal trends in investors’ intentions and overall market sentiment.
Exchange inflows
Exchange inflows refers to the total value of assets received by cryptocurrency exchanges. Exchanges are where cryptocurrency users go to trade, so large increases in exchange inflows can signal significant market movements to come. A great example of this came in March 2020 at the outset of the Covid crisis. As the reality of the pandemic began to set in, cryptocurrencies, along with stocks and other more traditional assets, saw their prices plummet, with most of the fall occurring on March 12 and 13. On the days of those price drops, exchanges saw their largest inflows ever.
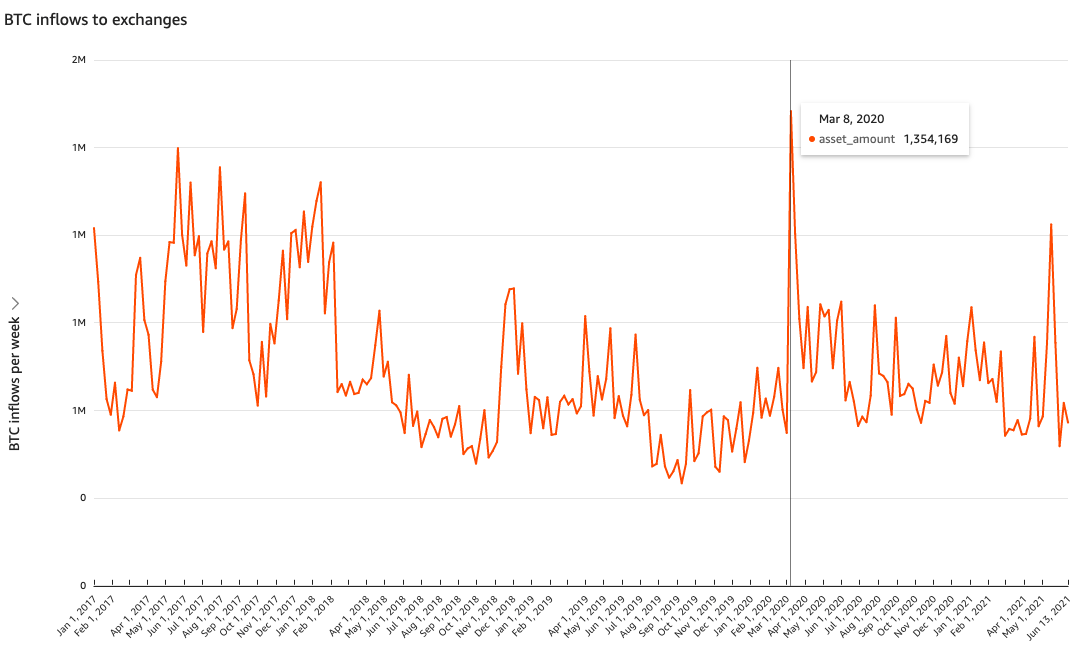
In the seven days from March 8 to March 17, exchanges received a total of 1.35 million Bitcoin, peaking at over 413,000 Bitcoin on March 13, compared to an average of 524,000 Bitcoin per week previously in 2020. The example goes to show how useful on-chain data can be for predicting future price movements.
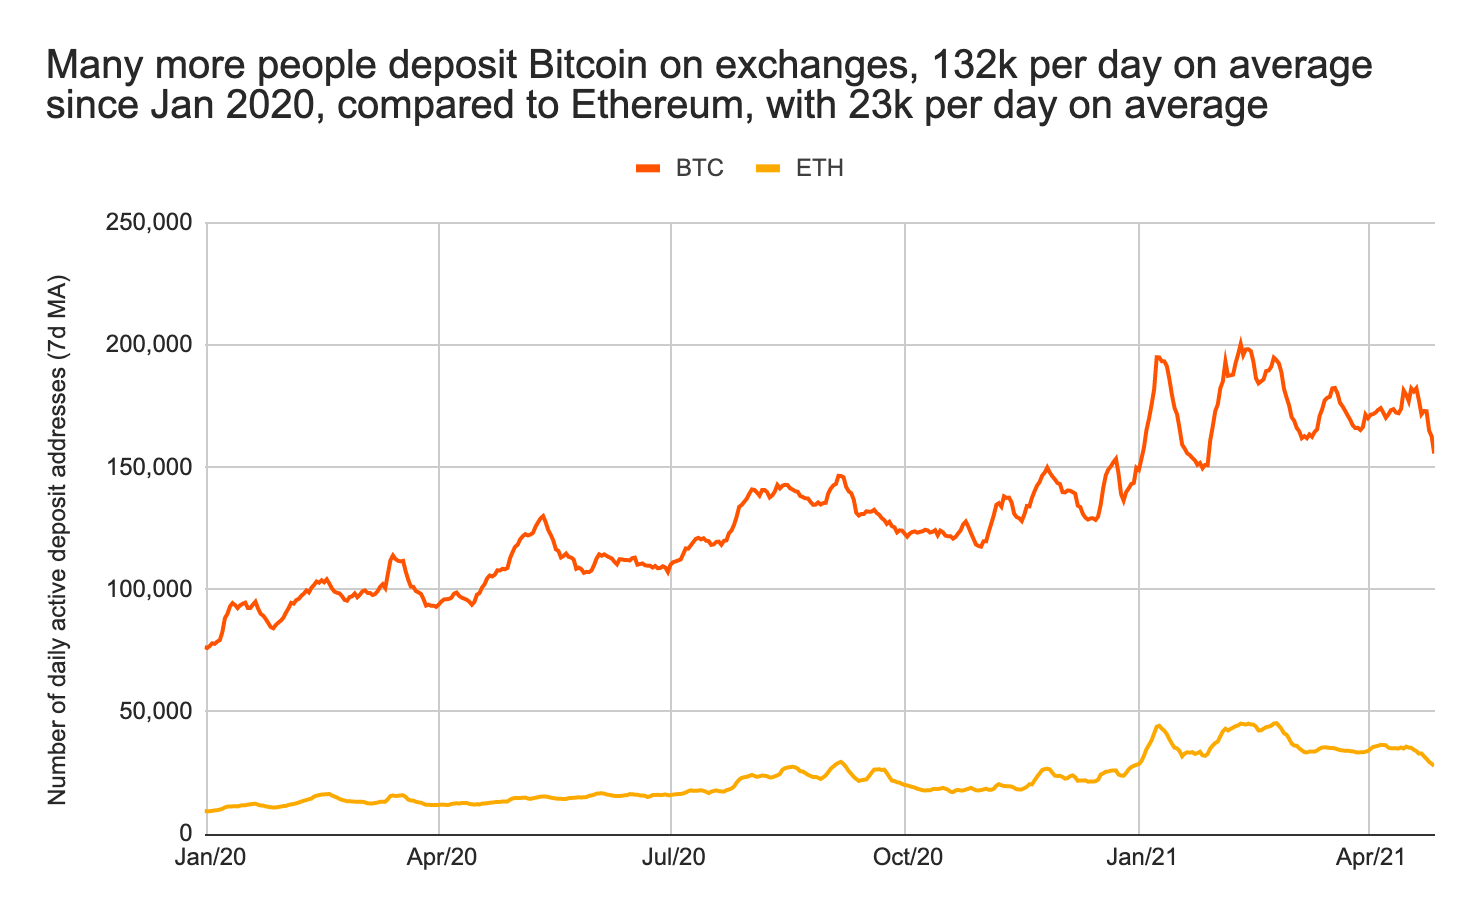
We can also use exchange inflows to learn more about the differences between holders of different cryptocurrencies. For instance, if we break down the wallets responsible for inflows, we see that many more individual users are sending Bitcoin to exchanges compared to Ethereum.
Even more interesting is the concentration amongst Ethereum traders. Exchange inflow data shows that since June 2020, the top ten users depositing the most Ether to exchanges account for 53% of all Ether deposited, compared to 22% for the top ten Bitcoin depositors.
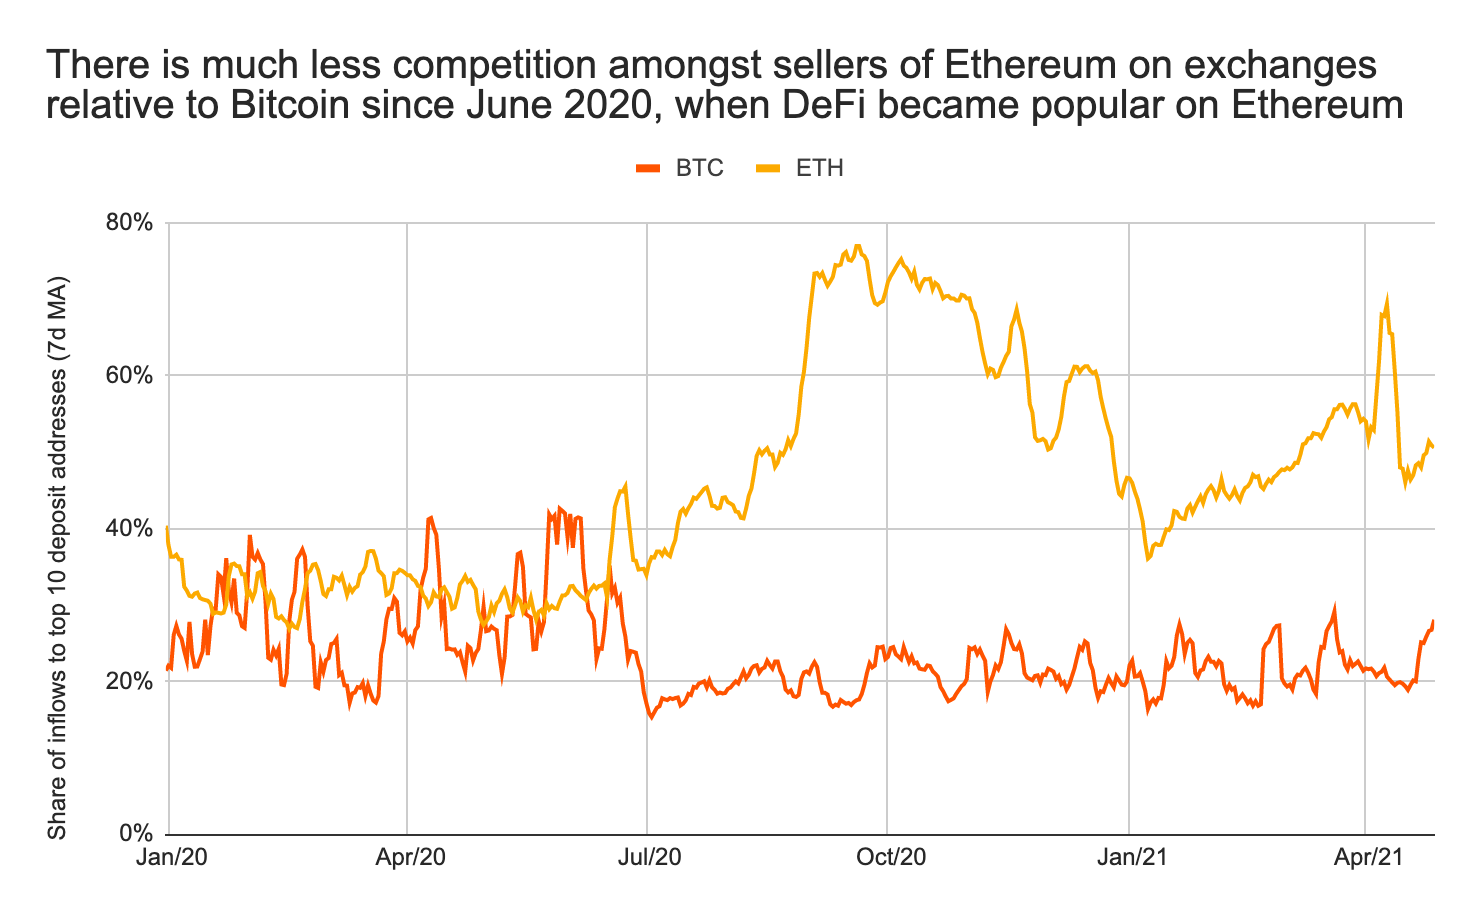
Users typically move assets to exchanges in order to sell it, so this level of concentration suggests that there’s much less competition amongst sellers of Ethereum compared to Bitcoin. This trend also arises at a time when Ether inflows to exchanges are increasingly coming from DeFi platforms, and suggests that those platforms are similarly dominated by a small number of large users compared to centralized exchanges.
Inter exchange flows
While exchange inflows allow users to track cryptocurrency received by exchanges broadly, Market Intel also allows users to track flows to and between specific types of exchanges. These include:
- Crypto-to-crypto (C2C) exchanges. C2C exchanges only allow trades between different cryptocurrencies and don’t support fiat currency.
- Crypto-to-fiat (C2F) exchanges. C2F exchanges allow users to exchange fiat for cryptocurrency and vice versa, making them the primary destination for first-time cryptocurrency users and for those who want to cash out.
- Derivatives-only exchanges. These exchanges allow more advanced traders to buy and sell derivatives similar to those we see in traditional finance, such as options and futures.
- Decentralized exchanges (DEXes). An important part of the DeFi ecosystem, DEXes are peer-to-peer exchanges running on automated smart contracts. With no intervening third parties or centralized authority, DEXes can operate independent of any individual, company, or organization.
Inter-exchange flows show the level of arbitrage and market-making activity, as traders move cryptocurrency back and forth between exchanges to take advantage of spreads in prices.
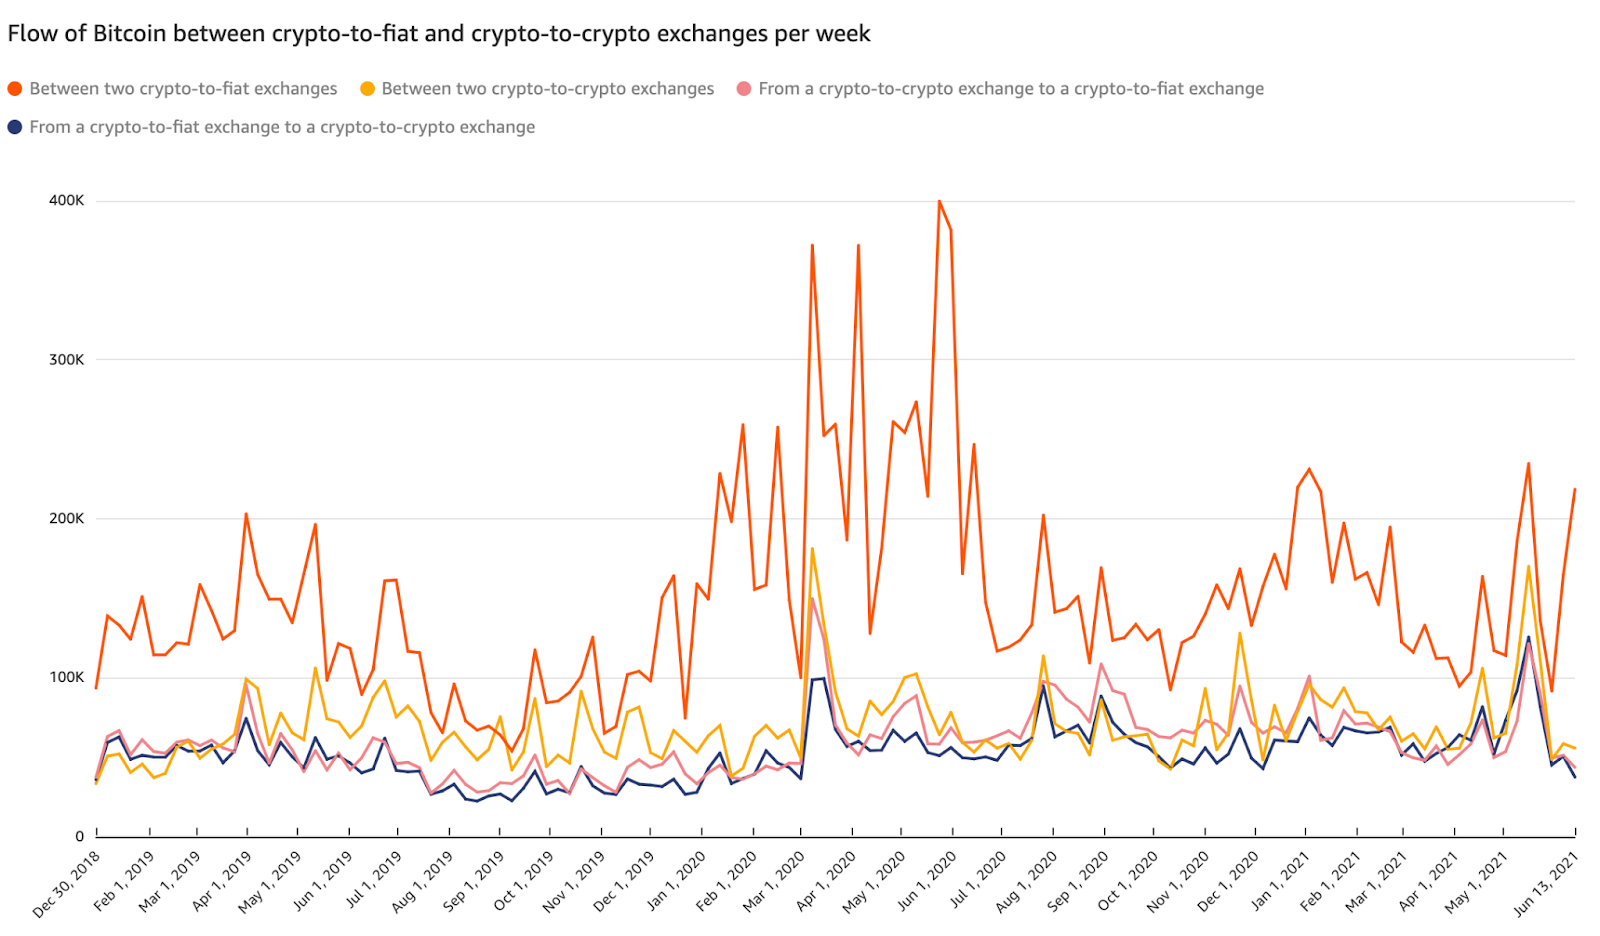
Inter-exchange flows can also signal important changes in trader sentiment and market direction. Because different types of exchanges have different use cases, a significant change in value received by one type or another can mean that traders are pursuing new strategies. For instance, a large increase in flows from crypto-to-crypto exchanges to crypto-to-fiat exchanges could mean that traders are looking to exchange crypto assets for fiat, which could force prices down as money may then leave the crypto ecosystem.
Trade intensity
Trade intensity measures the ratio between the amount of a specific cryptocurrency an exchange receives on-chain – meaning from the wider cryptocurrency ecosystem outside the exchange itself – and how often that cryptocurrency is traded between the exchange’s users. In other words, trade intensity tells us how many times a crypto asset is traded within an exchange after being deposited to that exchange.
Higher trade intensity often signals that more exchange users want to buy a specific crypto asset than want to sell, as it shows that there is demand for the asset on that exchange but little new deposits of the asset to meet that demand. We saw an example of this in mid-March 2021, a time when trade intensity had recently plateaued after rising steadily from the beginning of December.
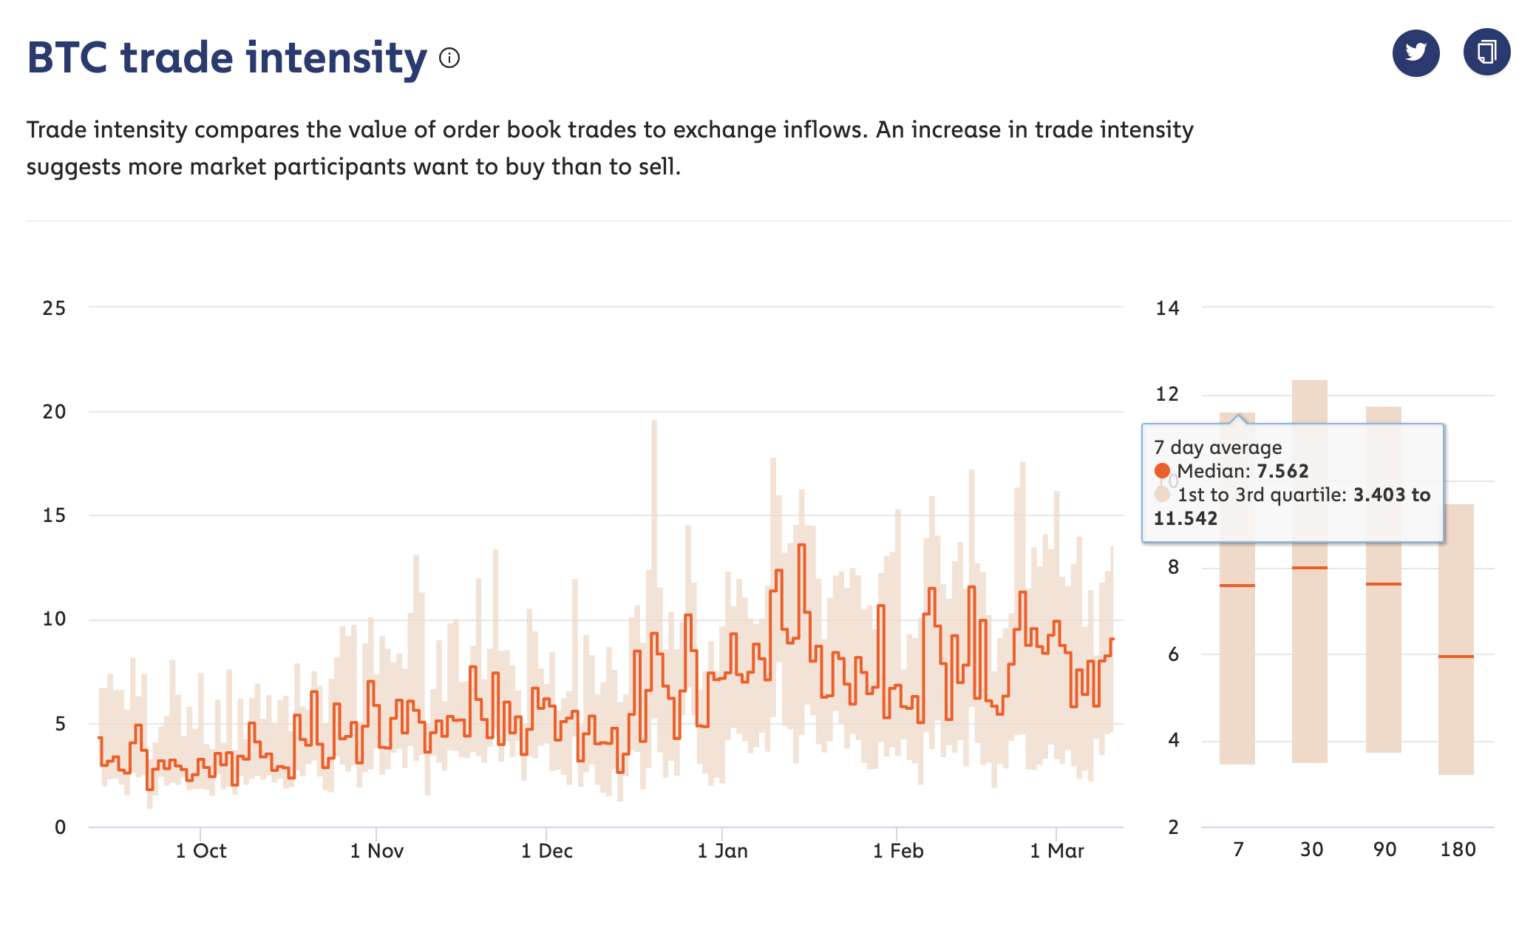
With demand on exchanges already high, Bitcoin inflows also began to drop, with the seven-day average falling to 57,400 BTC per day, 29% below the 180-day average. The decrease in liquidity at a time of high demand drove Bitcoin’s price to a then-record high of over $58,000 during the week of March 12.
Liquidity
Liquidity measures how likely an entity on the blockchain — self-hosted or a business — is to send the cryptocurrency it receives to another entity. Mathematically, liquidity is calculated by taking the average ratio of net to gross cryptocurrency flows over the lifetime of the entity in question. We characterize an entity as highly liquid if it sends on average two thirds or more of all assets it receives, liquid if it sends between one quarter and two thirds of all assets received, and illiquid if it sends a quarter or less of all assets it receives. When gross flows are equal to net flows, then an entity is just receiving assets.
In general, illiquid entities tend to be investors, as they are buying to hold, while liquid entities tend to be more active traders, who move assets in and out of their wallets. Market Intel allows users to track how cryptocurrency is flowing between entities of differing liquidity the same way they can track flows between different types of services. If more assets are flowing to illiquid entities, it means there are fewer assets available to buy, which can lead to higher prices.
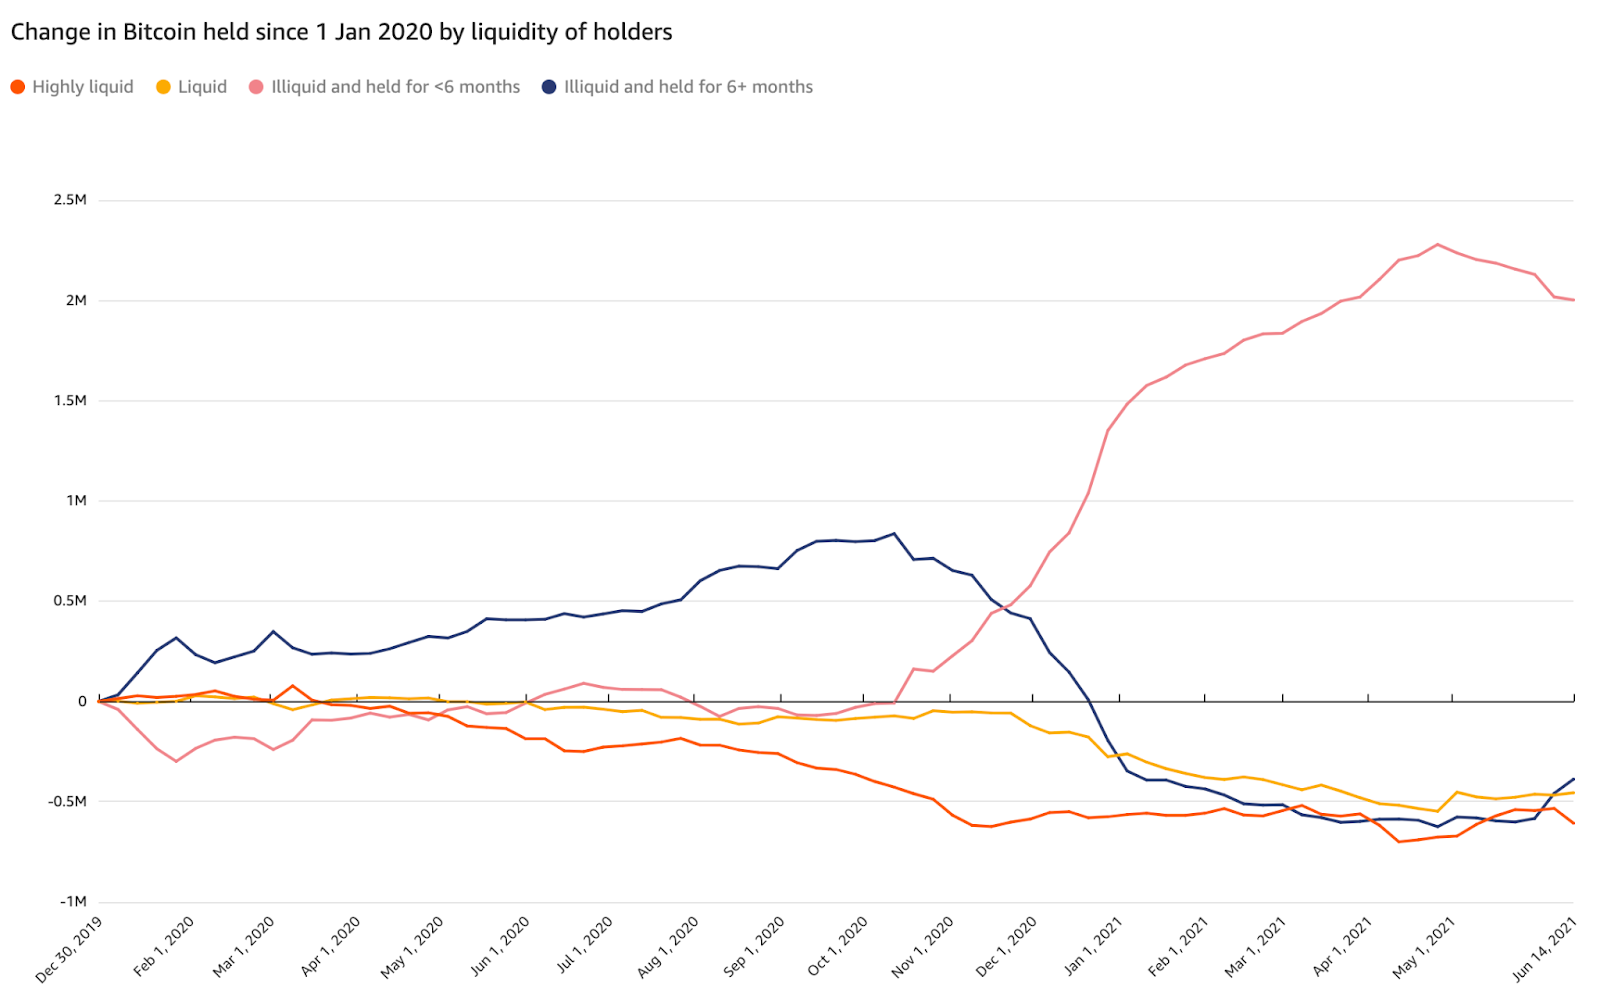
Liquidity of Bitcoin holders was a big part of why the asset’s price rose at the end of 2020 and into early 2021. As we see above, while long-term illiquid wallets decreased their Bitcoin holdings starting around October 2020, far more Bitcoin flowed to newer illiquid wallets, with the resulting scarcity driving up Bitcoin’s price.
Make data your advantage
Better data is one of the biggest advantages an organization can have, especially when it comes to cryptocurrency. Whether you’re a seasoned veteran of the industry or your firm is just now entering the cryptocurrency market for the first time, blockchain data can help you spot opportunities and risks others miss. That’s why we’re so excited about Market Intel. You can see a sample of the metrics here and click here to contact us to learn more about how Market Intel can make your team more effective.