
This blog is a preview of our State of Web3 Report. Sign up here to download your copy!
Non-fungible tokens (NFTs) have been one of the most dynamic and prominent parts of Web3 over the last two years. NFTs are blockchain-based digital items whose units are designed to be unique, unlike traditional cryptocurrencies whose units are meant to be interchangeable. NFTs store data on blockchains, and that data can be associated with files containing media such as images, videos, and audio, or even in some cases physical objects. NFTs typically give the holder ownership over the data, media, or object the token is associated with, and are commonly bought and sold on specialized marketplaces.
NFTs saw explosive growth in 2021, but this growth hasn’t been consistent and has leveled off so far in 2022. Below, we’ll explore how the NFT market has grown and contracted since the beginning of 2021.
NFT activity growing since 2021, but not consistently
Since the beginning of 2021, NFT transaction volume has grown significantly, but this growth fluctuates. NFT activity ebbs and flows month to month — in 2022 thus far, the value sent to NFT marketplaces continued its 2021 growth in January, entered a downturn in February, and then began to recover in mid-April.
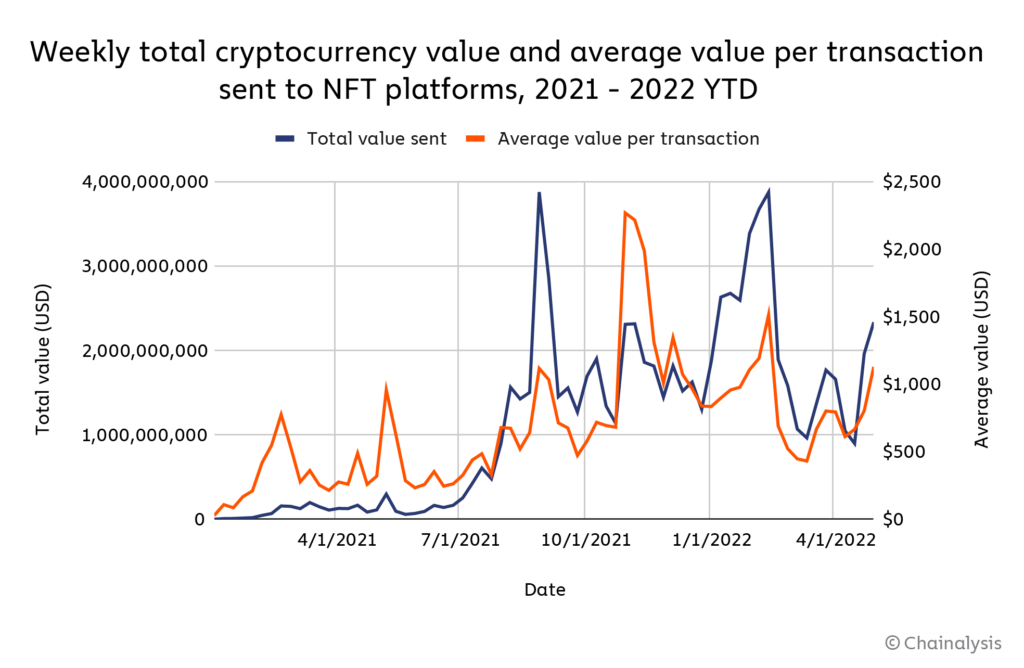
Overall, collectors have sent over $37 billion to NFT marketplaces in 2022 as of May 1, putting them on pace to beat the total of $40 billion sent in 2021. However, since late summer 2021, NFT transaction growth has come in fits and starts, with activity largely remaining flat except for two big spikes: One in late August, which was likely driven by the release of the Mutant Ape Yacht Club collection, and one stretching from late January to early February of 2022, which was likely driven by the launch of the LooksRare NFT marketplace.
After that spike though, NFT transaction activity declined significantly beginning in mid-February, dropping from $3.9 billion the week of February 13 to $964 million the week of March 13 — the lowest weekly level since the week of August 1, 2021. The NFT market began to recover in mid-April, however, and is now approaching the weekly volumes it hit earlier in the year, likely due to the recent launch of Bored Ape Yacht Club’s metaverse project.
Despite these fluctuations in transaction volume, the number of active NFT buyers and sellers continues to grow.
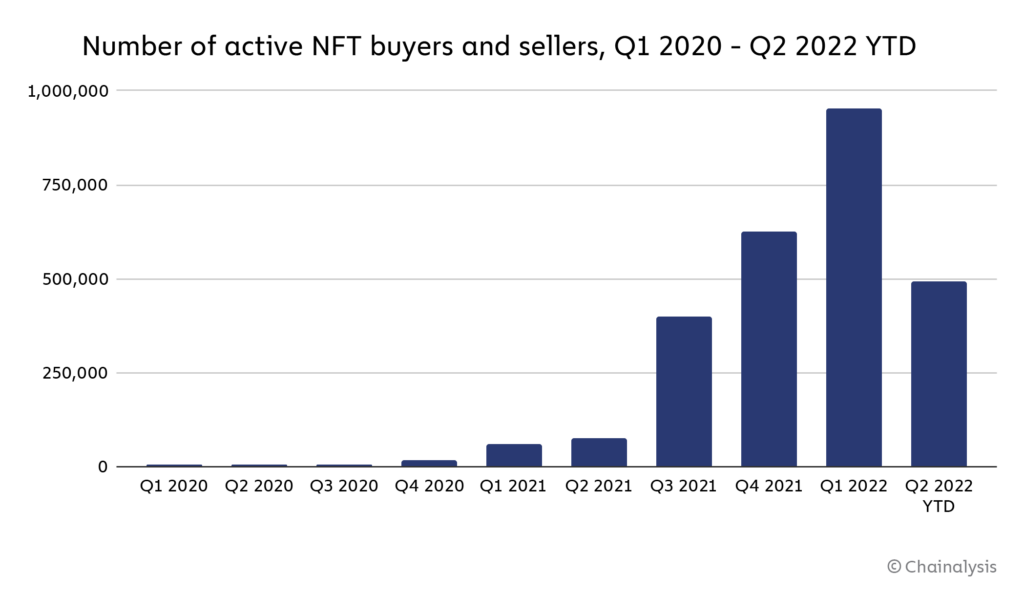
In Q1 2022, 950,000 unique addresses bought or sold an NFT, up from 627,000 in Q4 2021. Overall, the number of active NFT buyers and sellers has increased every quarter since Q2 2020. In Q2 2022 as of May 1, 491,000 addresses have transacted with NFTs, putting the NFT market on pace to continue its quarterly growth trend in number of participants.
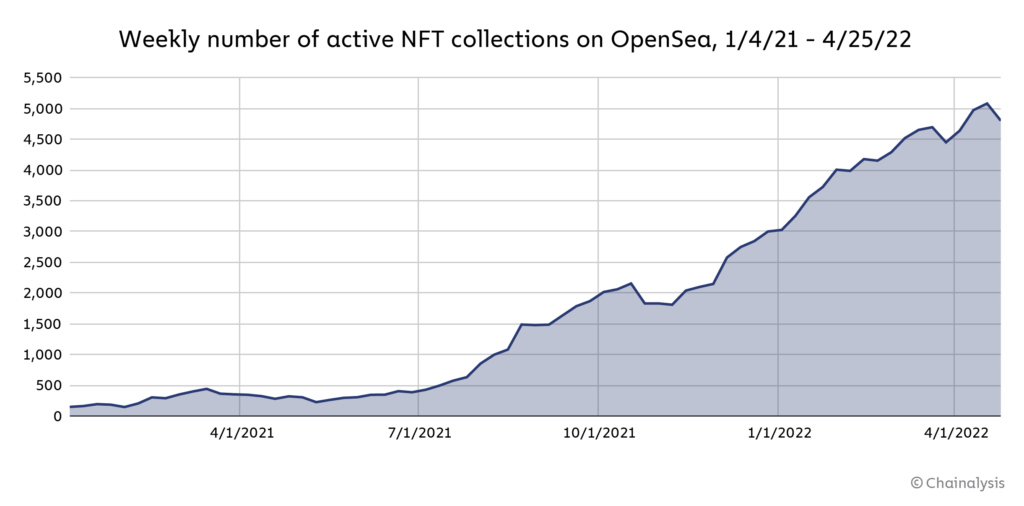
The number of active NFT collections on OpenSea — meaning those with any transaction activity in a given week — has also grown consistently since March 2021, and currently sits above 4,000.
Who uses NFTs?
Analysis of web traffic to popular NFT platforms reveals that the asset class attracts users from all over the globe.
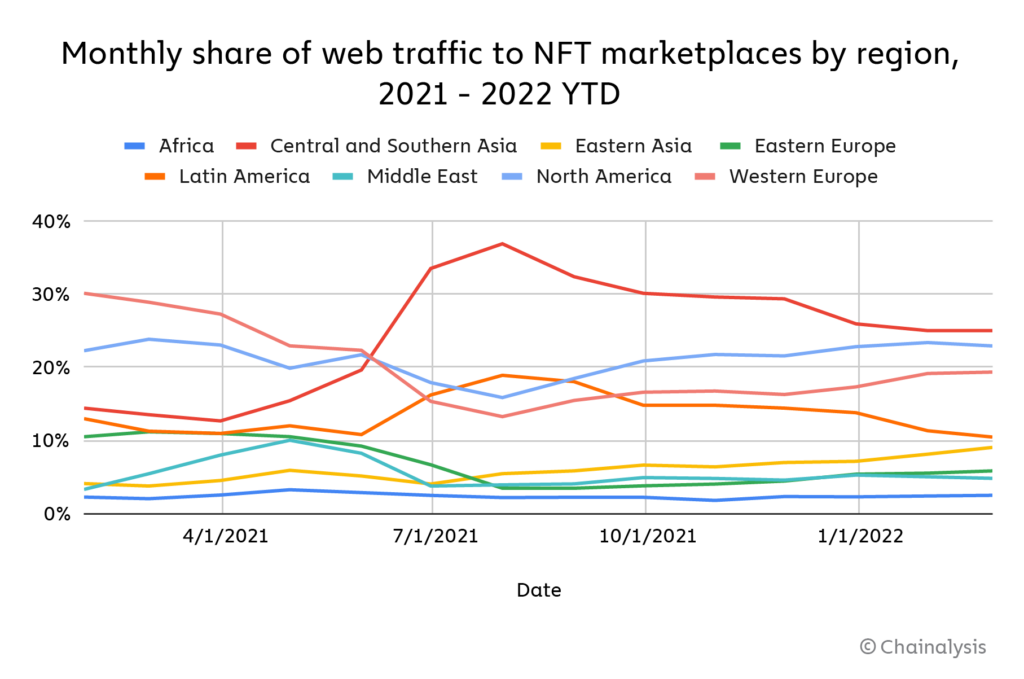
Central & Southern Asia leads the way, followed by North America and Western Europe. While some regions certainly lag, the fact that no region has made up more than 40% of all web traffic since the beginning of 2021 suggests that, like cryptocurrency as a whole, NFTs have captured a global audience.
Analysis of NFT transaction sizes can also tell us a great deal about who’s investing and collecting.
![]()
The vast majority of NFT transactions are at the retail size, meaning below $10,000 worth of cryptocurrency. NFT collector-sized transactions (between $10K and $100K) grew significantly as a share of all transfers between January and September of 2021, but since then have stayed flat. This suggests that, for the time being, the addition of new retail NFT investors is keeping pace with the addition of bigger NFT investors.
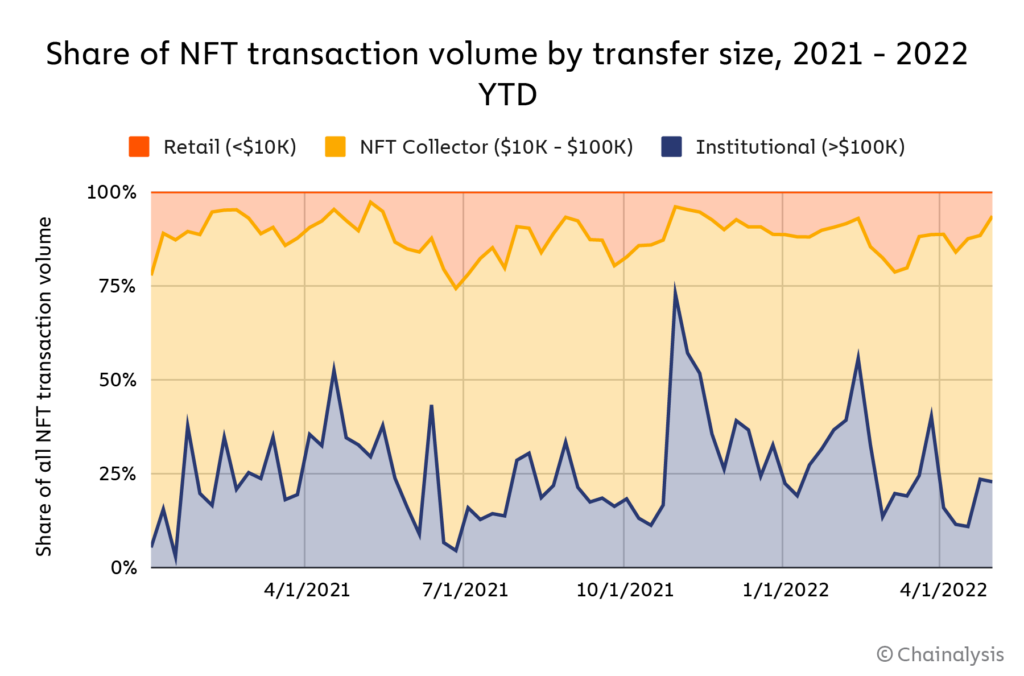
However, if we think in terms of transaction value rather than number of transfers, we see that NFT collectors make up a majority of activity. Institutional investors are nipping at their heels, and even make up the majority of activity in certain weeks when extremely large purchases have been made. For instance, during the week of October 31, 2021, institutional transfers made up 73% of all activity, largely due to the purchase of several NFTs in the Mutant Ape Yacht Club collection. More institutional-sized transfers followed in subsequent weeks, and since then, institutional transfers make up 33% of all activity.
However, as is the case with the NFT market as a whole, the growth of institutional-sized NFT transactions hasn’t been consistently sustained.
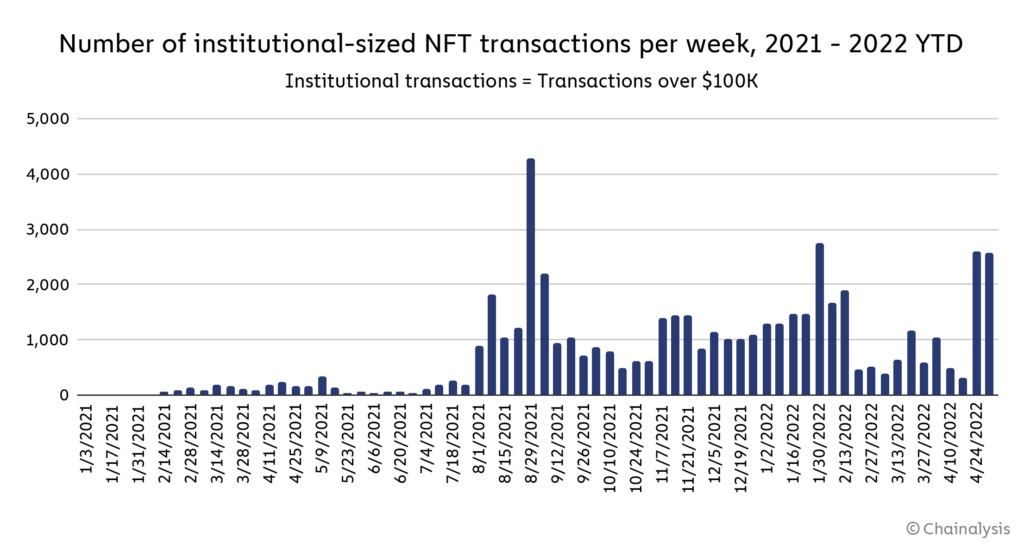
Between late November and mid-February, institutional NFT purchasing grew each week, reaching 1,889 transactions the week of February 13, after having spiked to 2,739 two weeks prior. Institutional NFT activity fell abruptly after that, dropping to just 473 transactions during the week of February 20. As of April 17, 2022, institutional NFT activity has yet to reach the levels it did in the winter of 2021. This period of reduced institutional activity also roughly coincides with what appears to be an overall decline in interest in NFTs generally.
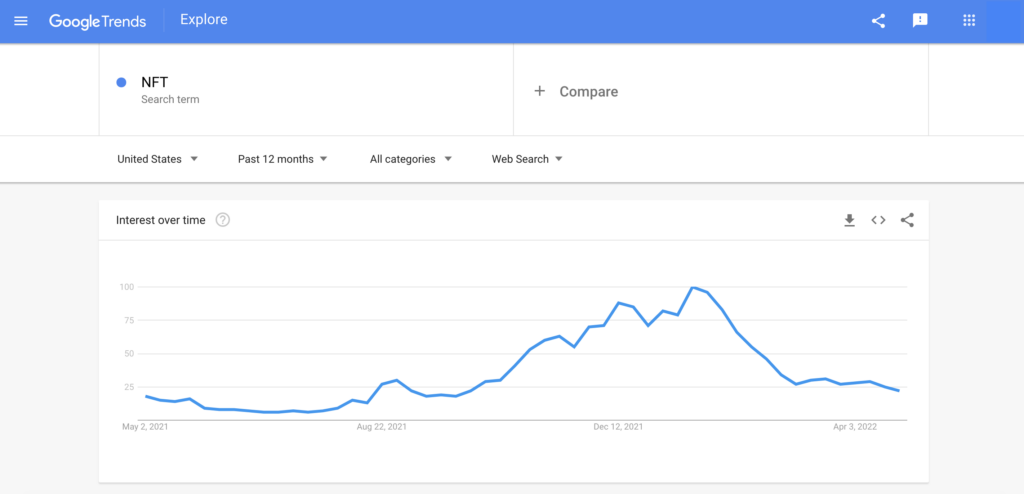
Credit: Google Trends
We make no claims as to the statistical relationship between Google searches for NFTs and NFT transaction activity, at the institutional level or any other. However, it’ll be interesting to observe whether NFTs can recapture the broad public interest they achieved in late 2021, and whether this leads to increased transaction activity or rising prices for popular NFT collections.
This blog is a preview of our State of Web3 Report. Sign up here to download your copy!
This material is for informational purposes only, and is not intended to provide legal, tax, financial, or investment advice. Recipients should consult their own advisors before making these types of decisions. Chainalysis has no responsibility or liability for any decision made or any other acts or omissions in connection with Recipient’s use of this material.
Chainalysis does not guarantee or warrant the accuracy, completeness, timeliness, suitability or validity of the information in this report and will not be responsible for any claim attributable to errors, omissions, or other inaccuracies of any part of such material.