
This blog is an excerpt from the Chainalysis 2021 Crypto Crime Report. Click here to download the whole thing!
Darknet markets set a new revenue record in 2020, bringing in a total of $1.7 billion worth of cryptocurrency—most of which was in Bitcoin (BTC).
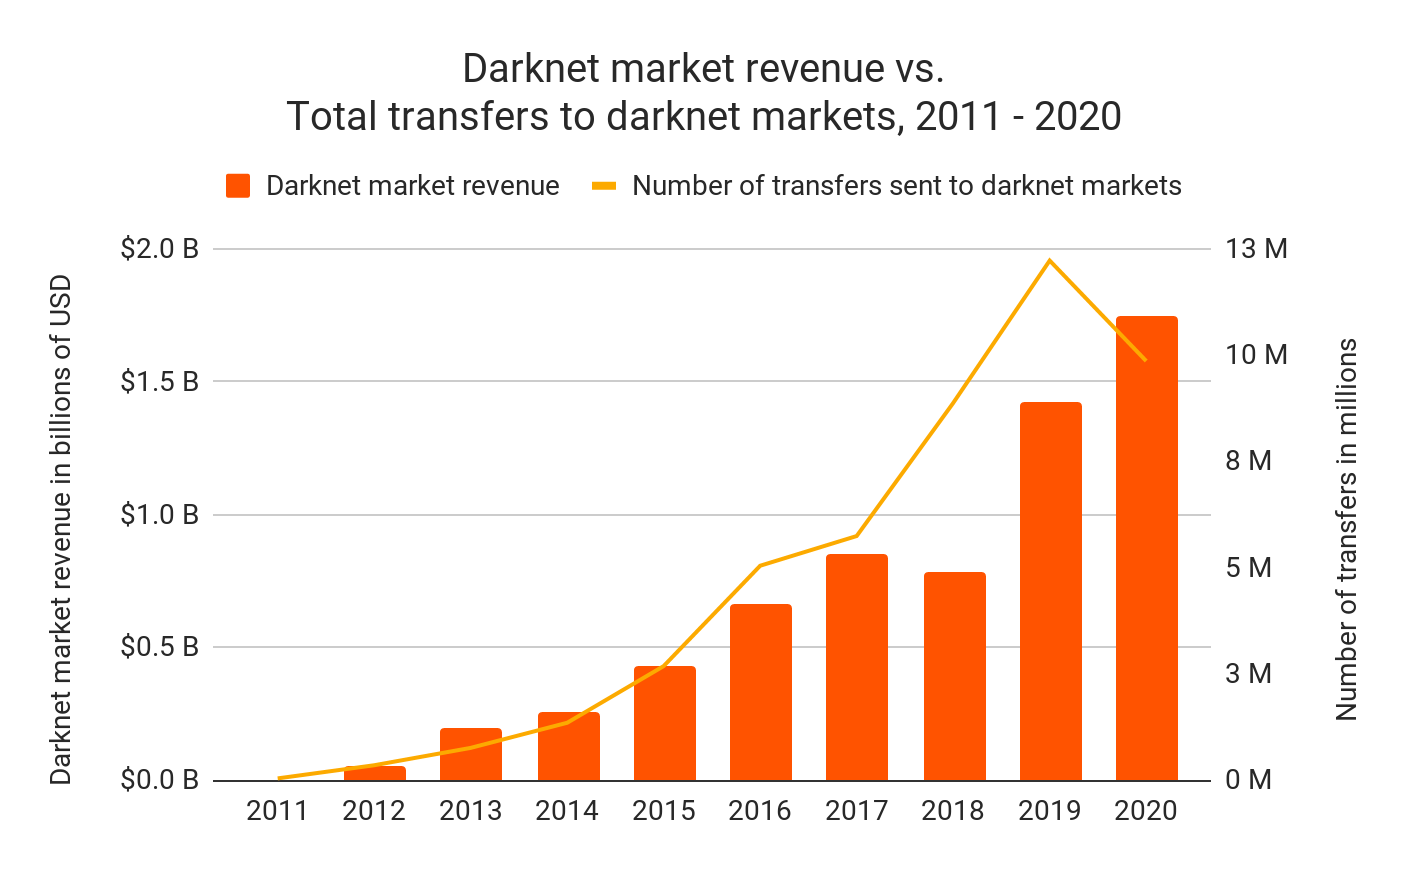
Interestingly, this record comes as individual purchases from darknet markets declined, falling from 12.2 million in 2019 to fewer than 10 million in 2020. However, if we look more closely, we see that nearly all of the growth in darknet market activity we see in 2020 can be attributed to one specific market: Hydra.
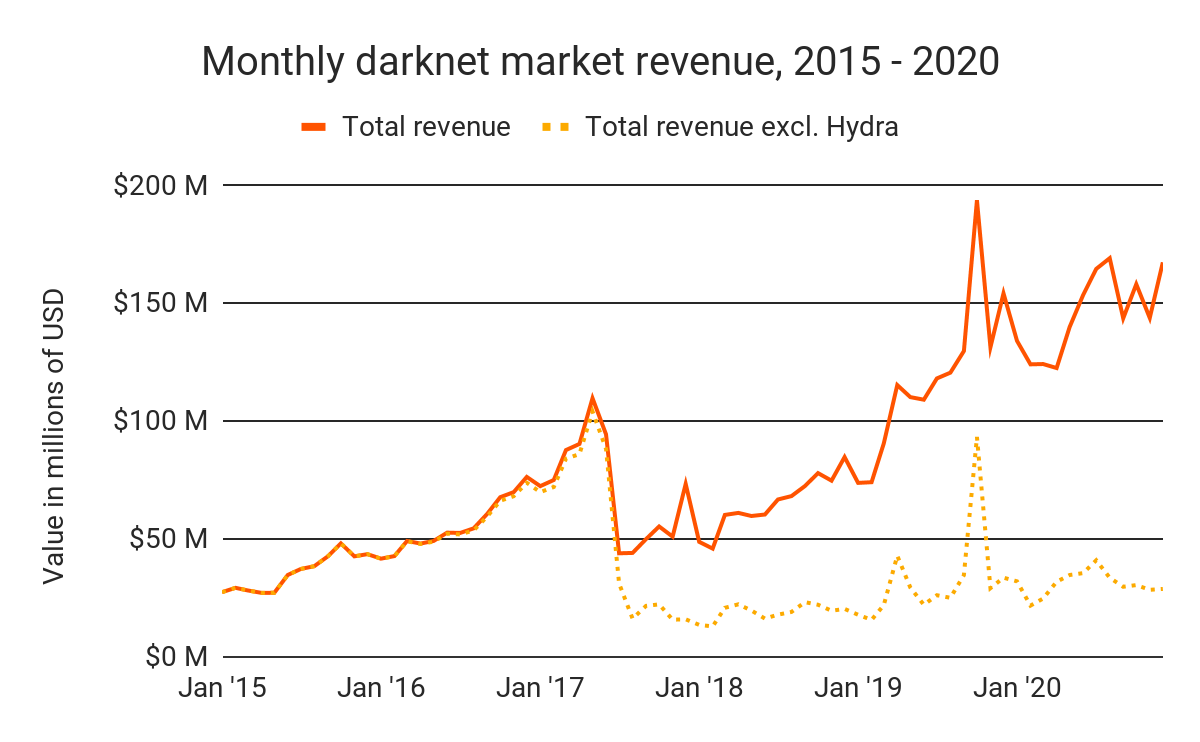
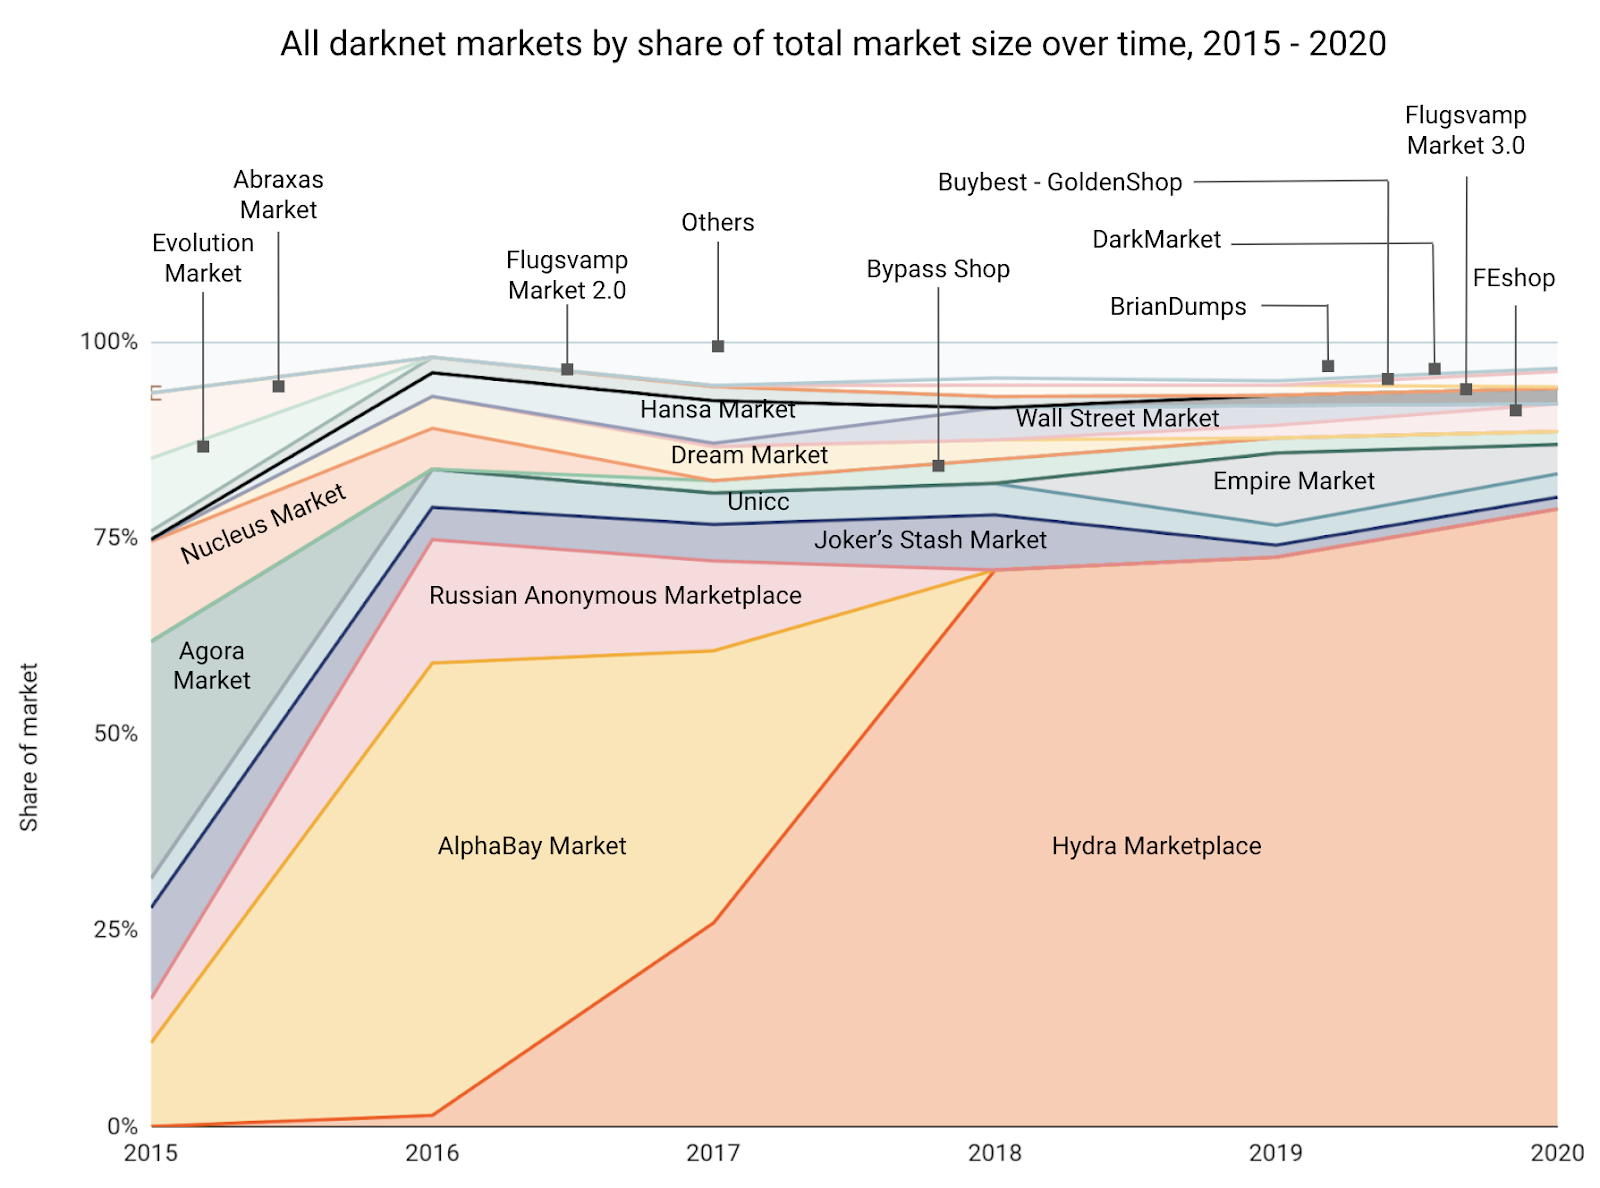
If we exclude Hydra, we see that darknet market revenue stayed roughly flat from 2019 to 2020. Hydra is unique in that it only serves Russian-speaking countries, and is by far the largest darknet market in the world, accounting for over 75% of darknet market revenue worldwide in 2020.
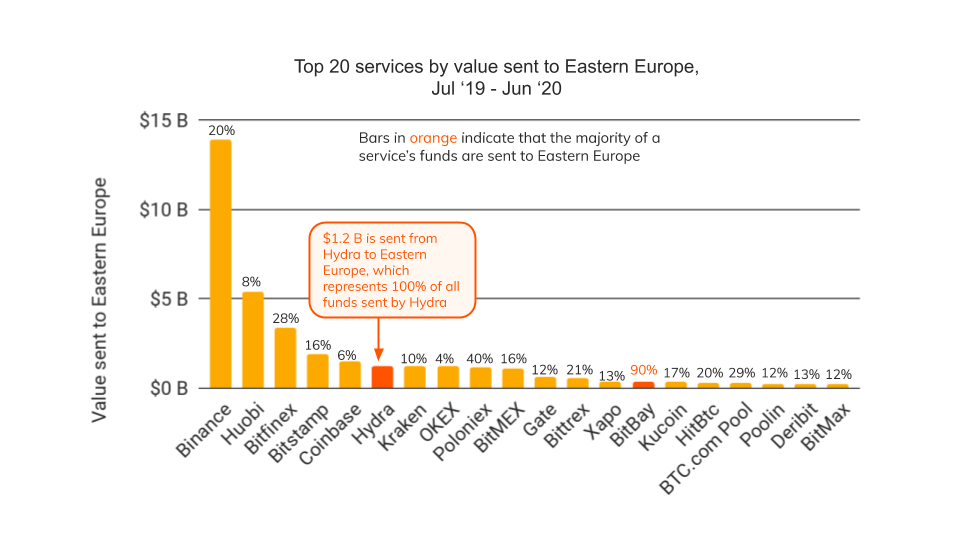
Hydra is a big driver of Eastern Europe’s unique crypto crime landscape. Eastern Europe has one of the highest rates of cryptocurrency transaction volume associated with criminal activity and, thanks to Hydra, is the only region with a criminal service as one of the top ten entities sending cryptocurrency value to the region.
Hydra could eventually come to the English-speaking world as well. In December 2019, Hydra announced plans to raise $146M in a Bitcoin-based ICO for a new global service on the dark web called Eternos. While it appears Covid has put this BTC fundraising plan on hold, the announcement makes it clear that Hydra plans to expand. That could pose a significant challenge for U.S. and European law enforcement, as Hydra has developed uniquely sophisticated operations, such as an Uber-like system for assigning drug deliveries to anonymous couriers, who drop off their packages in hidden public locations, commonly referred to as “drops,” which are then shared with the buyers. That way no physical exchange is made, and unlike other markets on the dark web, vendors don’t need to risk using the postal system.
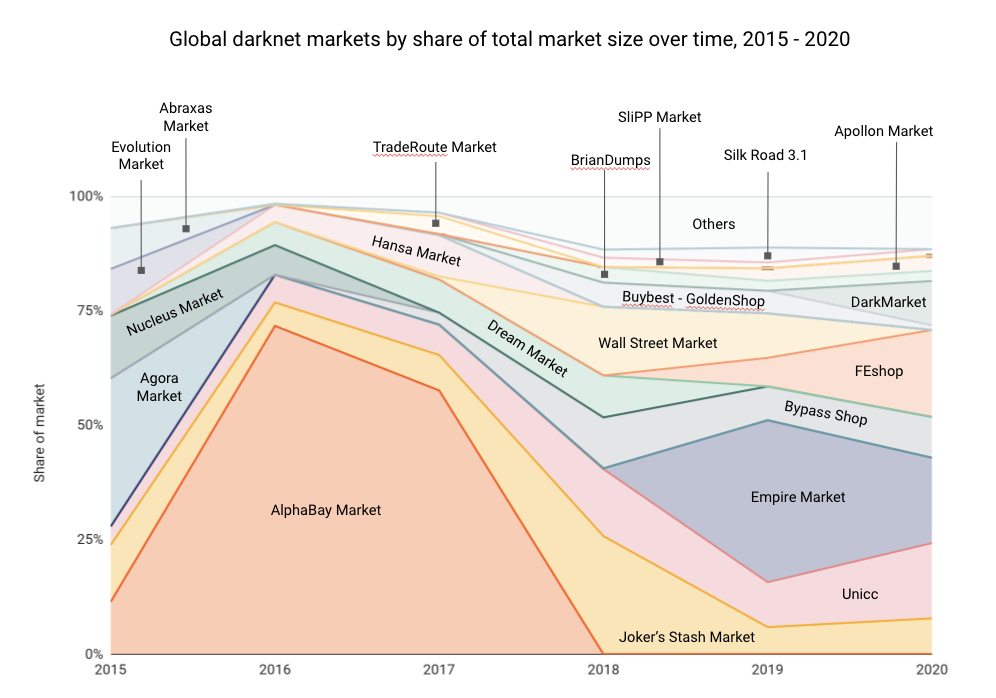
If we exclude Hydra and other darknet marketplaces that serve customers in a particular region, we see that darknet market activity is much less concentrated in the English-speaking world, with several different markets taking in significant revenue. Interestingly, we see that many of the largest markets are fraud shops, which sell stolen credit card information and other data that can be used for fraud, including personally identifying information (PII), SOCKS5, stolen accounts for different services, and hacking exploits.
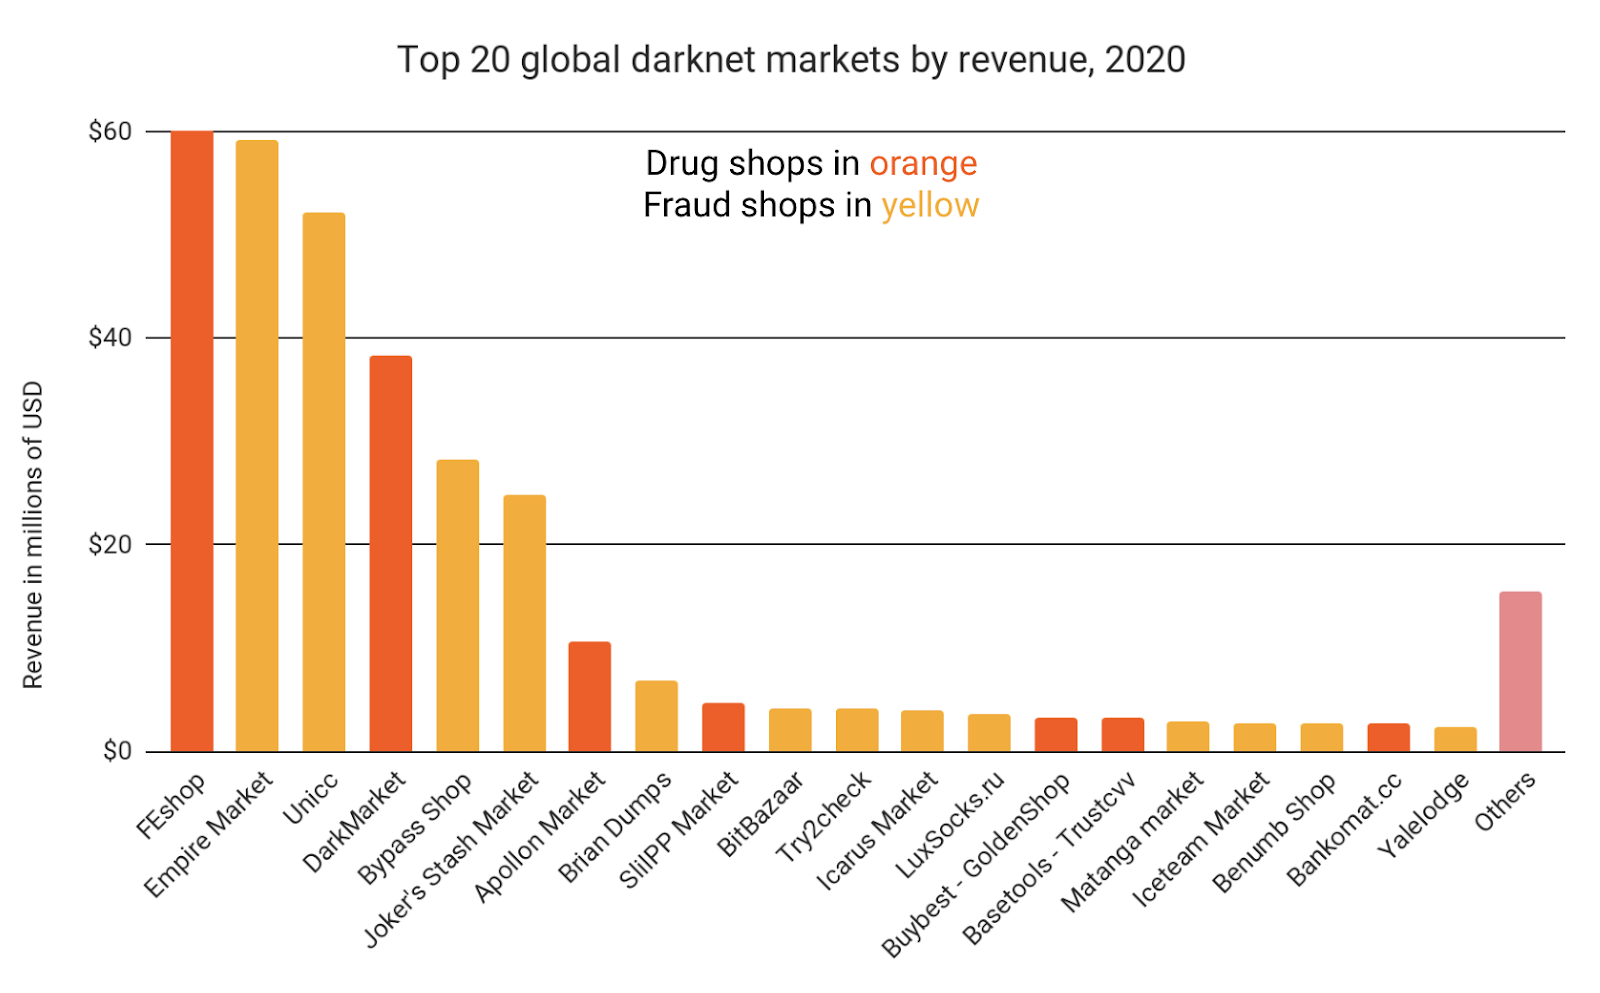
In fact, when we exclude Hydra and other markets that serve customers in a particular region, we see that fraud shops surpass drug market in revenue amongst global darknet black markets. And much like drug markets, fraud shops on the dark web collect the majority of their revenues in Bitcoin.
What kinds of services are darknet marketplace vendors and their customers using to facilitate these activities? We’ll start with the customers. Below, we break down the services sending cryptocurrency to darknet markets by volume.
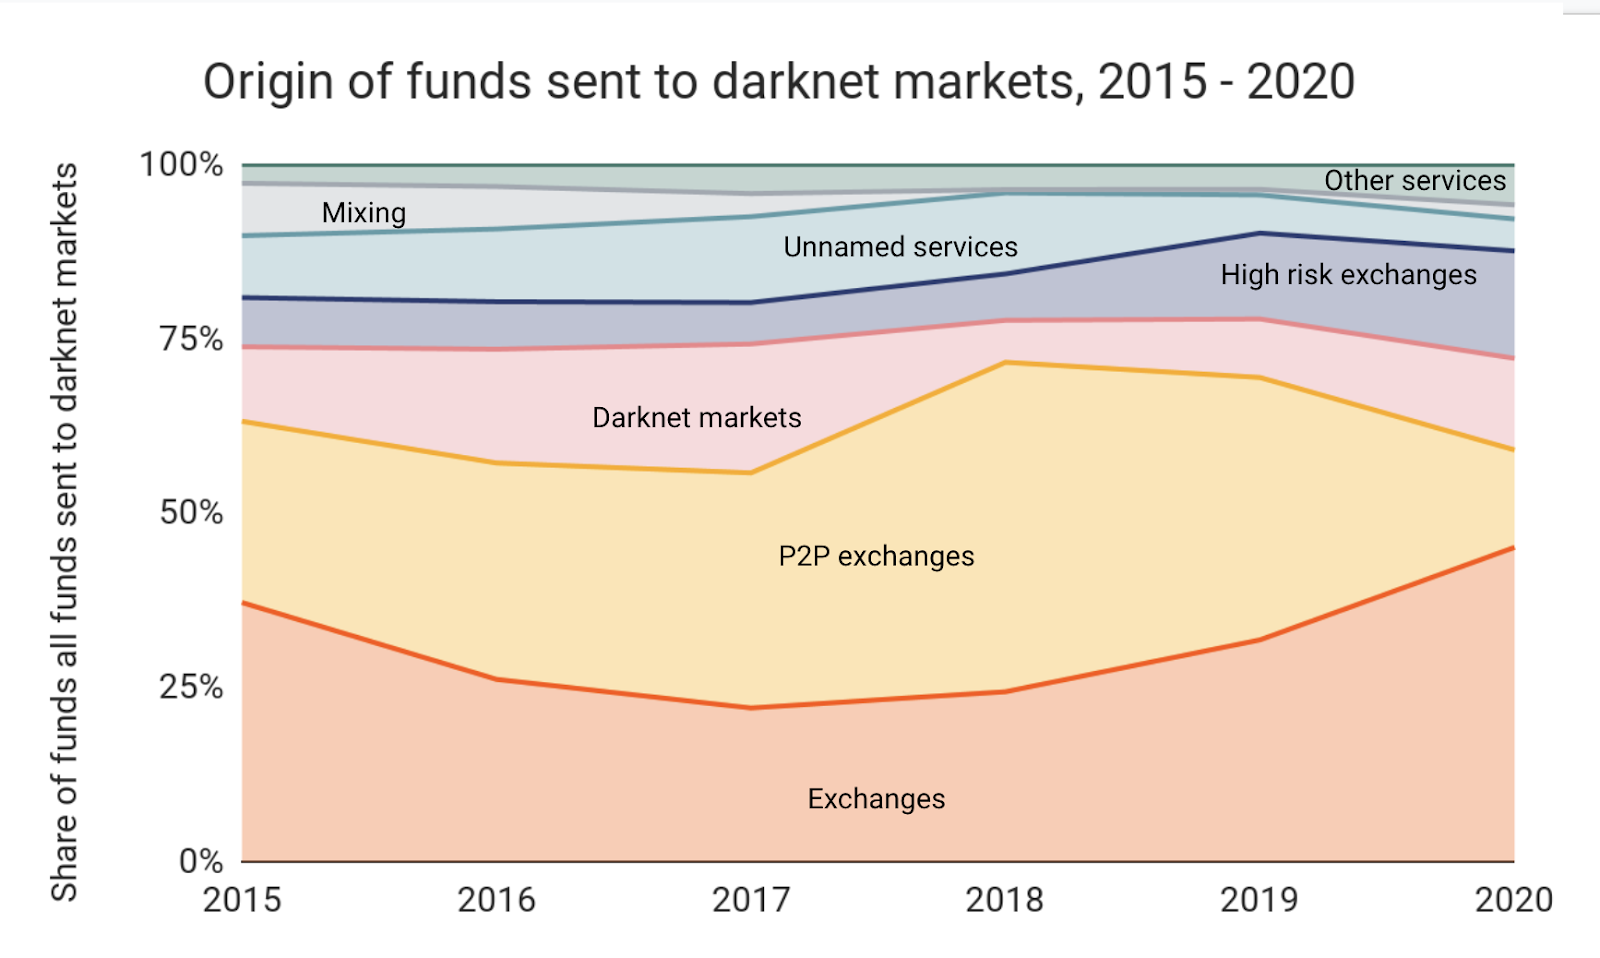
Standard crypto exchanges, peer-to-peer (P2P) exchanges, high-risk exchanges, and other darknet markets account for nearly all of the cryptocurrency sent to darknet markets. Interestingly, 2020 has seen standard exchanges send a larger share of total darknet market revenue — about 46% in 2020 versus 30% in 2019 — while P2P exchanges’ share has declined significantly. Given that standard exchanges tend to be more popular and easier to use, this could suggest that darknet markets attracted more first-time customers who are new to cryptocurrencies like Bitcoin in 2020, possibly due to declines in street sales during the Covid pandemic.
Below, we see the types of services receiving bitcoin and other cryptocurrencies from darknet markets, which we use to approximate where dark web marketplace vendors and administrators are cashing out their earnings.
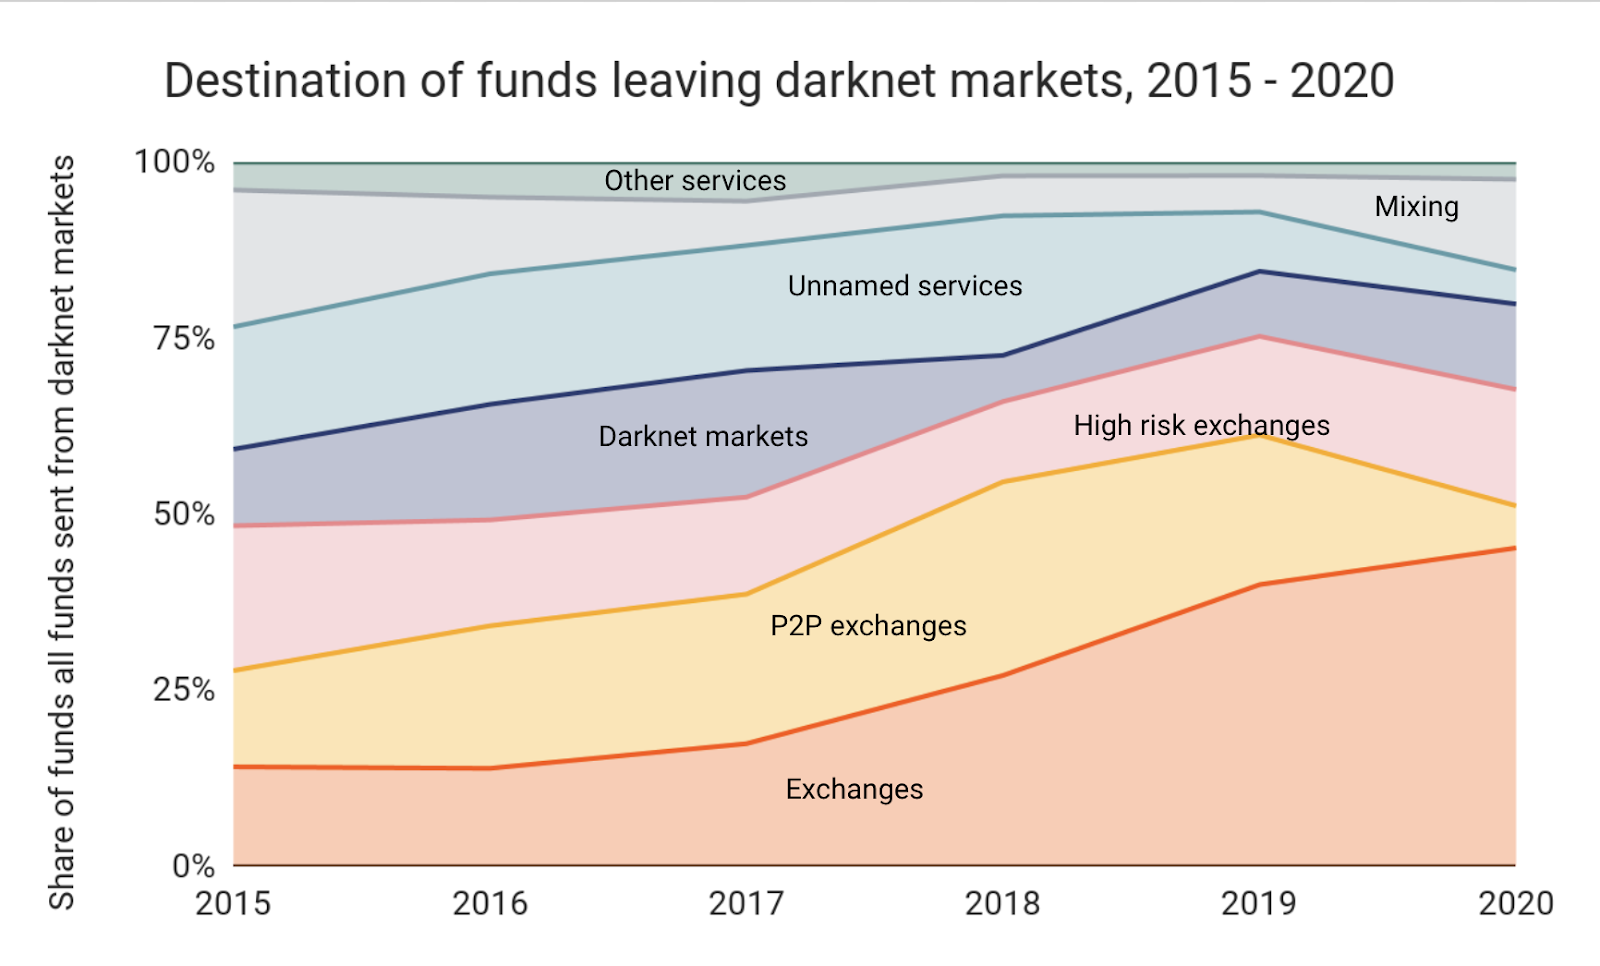
The numbers are somewhat similar to those on the receiving side, with standard exchanges taking in a larger share in 2020 compared to 2019, and P2P exchanges’ share declining. However, we also see a significant uptick in the amount of bitcoin going to mixers, with their share more than doubling from approximately 5% in 2019 to approximately 13% in 2020. This may reflect increasing caution from darknet market vendors and administrators following law enforcement crackdowns.
Geographic trends in darknet markets
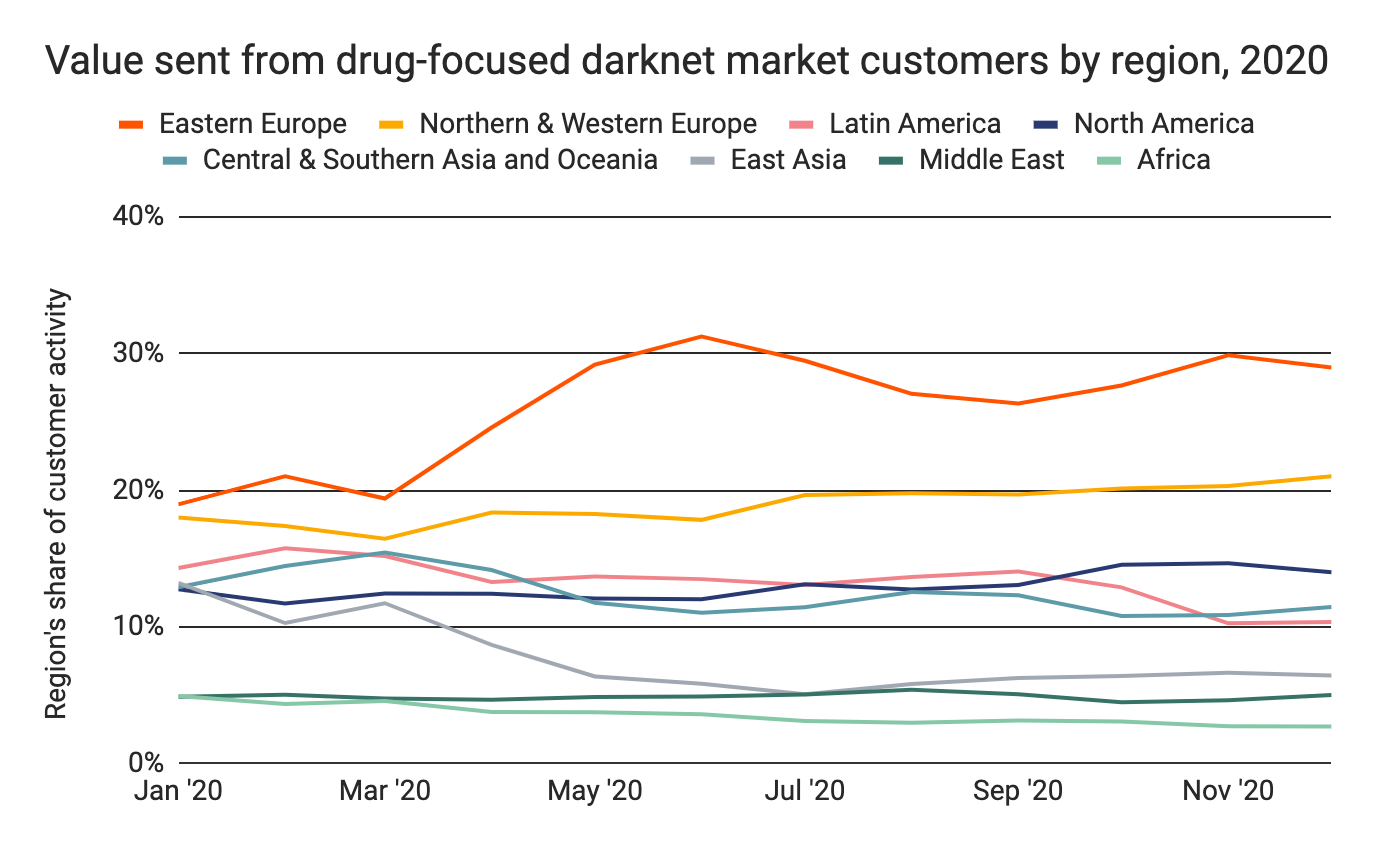
Looking at transaction data across the darknet marketplace ecosystem, we see that users in Eastern Europe, Northern & Western Europe, and North America are the biggest darknet market consumers, based on the specific services that have sent the most cryptocurrency to markets on the dark web.
Eastern Europe also receives by far the most value from darknet market vendor addresses, though much of this is due to massive volumes from Hydra, which is a major outlier market. Northern & Western Europe receives substantial amounts as well, as does Central & Southern Asia and Oceania, East Asia, Latin America, and North America.
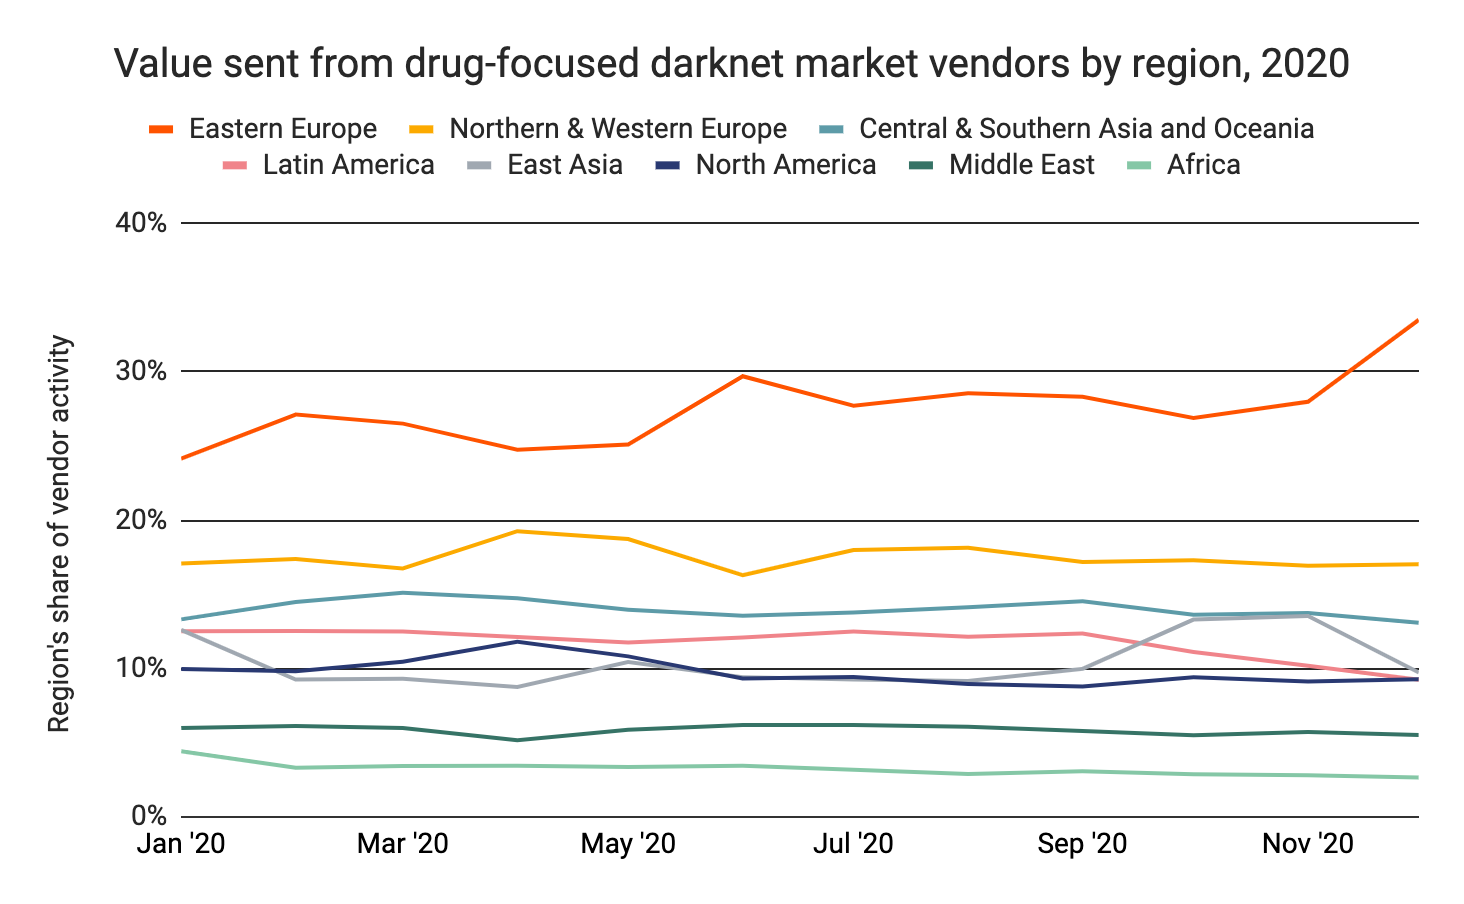
That pattern fits with what we know about the geography of the global drug trade. Generally speaking, drugs are grown or manufactured in Latin America and Asia and consumed in North America and Northern & Western Europe. Darknet vendors and administrators typically launder funds through cryptocurrency services — often over-the-counter (OTC) brokers — in China or Eastern Europe. We can see some of this activity in the blockchain data associated with darknet market transactions. On the map below, we show some of the most active individual countries’ exposure to darknet markets in terms of value both sent and received.
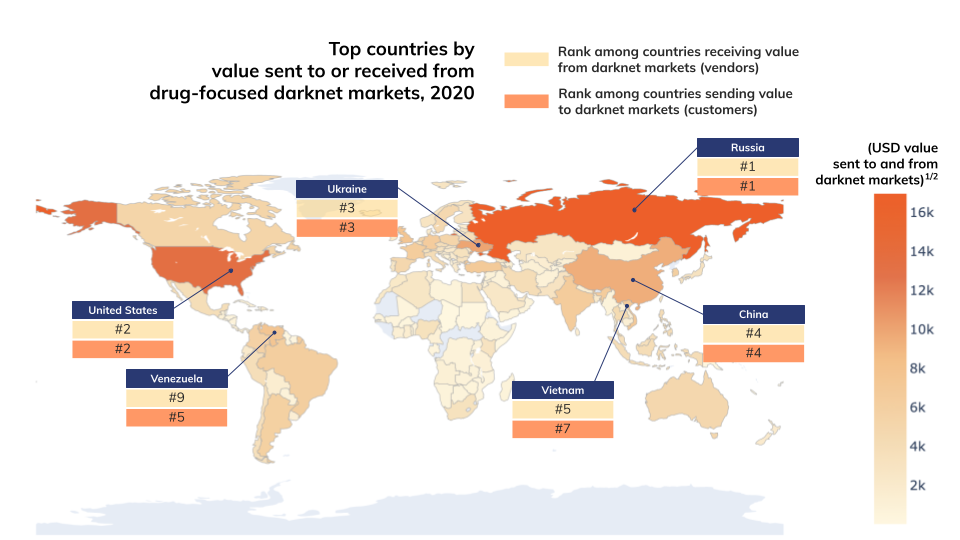
The geographic flows involving darknet markets roughly match what we would expect to see. The United States, Russia, Ukraine, and China dominate in terms of value both sent to and received from darknet markets. Venezuela and Vietnam also rank high on both sides, with their activity skewed slightly more toward darknet market buying, which could be related to the drug manufacturing activity prominent in both countries. We also suspect that a good deal of China and Russia’s volume received by darknet markets represents funds flowing to money laundering services concentrated in those countries, though it’s possible similar services are operating in other countries receiving large volumes of funds from darknet markets.
Below, we show the top ten countries by total cryptocurrency transaction volume flowing through darknet markets.
Russia
Rank: 1
Value sent to darknet markets: $169 million
Value received from darknet markets: $119 million
Total value sent to or received from darknet markets: $288 million
United States
Rank: 2
Value sent to darknet markets: $115 million
Value received from darknet markets: $64 million
Total value sent to or received from darknet markets: $179 million
Ukraine
Rank: 3
Value sent to darknet markets: $47 million
Value received from darknet markets: $52 million
Total value sent to or received from darknet markets: $98 million
China
Rank: 4
Value sent to darknet markets: $45 million
Value received from darknet markets: $43 million
Total value sent to or received from darknet markets: $87 million
United Kingdom
Rank: 5
Value sent to darknet markets: $33 million
Value received from darknet markets: $22 million
Total value sent to or received from darknet markets: $56 million
Venezuela
Rank: 6
Value sent to darknet markets: $35 million
Value received from darknet markets: $20 million
Total value sent to or received from darknet markets: $55 million
Vietnam
Rank: 7
Value sent to darknet markets: $24 million
Value received from darknet markets: $25 million
Total value sent to or received from darknet markets: $49 million
Turkey
Rank: 8
Value sent to darknet markets: $23 million
Value received from darknet markets: $22 million
Total value sent to or received from darknet markets: $45 million
India
Rank: 9
Value sent to darknet markets: $24 million
Value received from darknet markets: $18 million
Total value sent to or received from darknet markets: $42 million
Germany
Rank: 10
Value sent to darknet markets: $23 million
Value received from darknet markets: $18 million
Total value sent to or received from darknet markets: $41 million
In 2021 and beyond, it will be interesting to observe how these currency flows change as more of the global drug trade integrates cryptocurrencies like bitcoin.
This blog is an excerpt from the Chainalysis 2021 Crypto Crime Report. Click here to download the whole thing! To learn more about darknet markets in particular, watch our on-demand webinar on DNM typologies, shutdowns, and vendors’ money laundering strategies.